Manchester United attendance analysis – 2025/26

Stadium Games Total Average Change*
Leigh Sports Village10/1142,9754,298-6%
Old Trafford1/1124,98324,98324%
Total11/1167,9586,178-16%
Change* – 2025/26 average attendance compared to 2024/25.

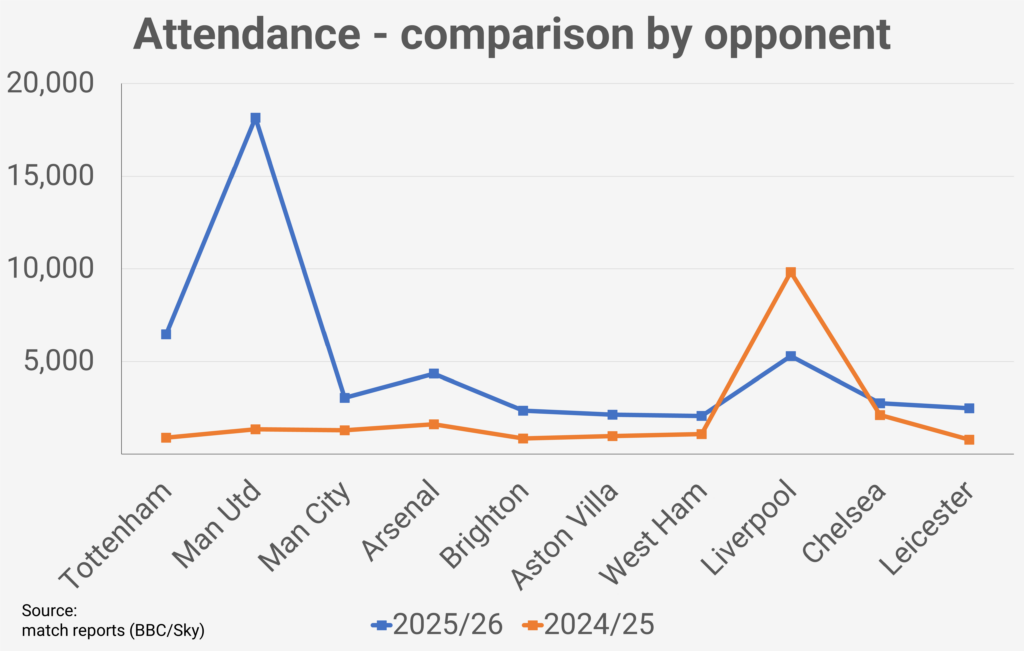
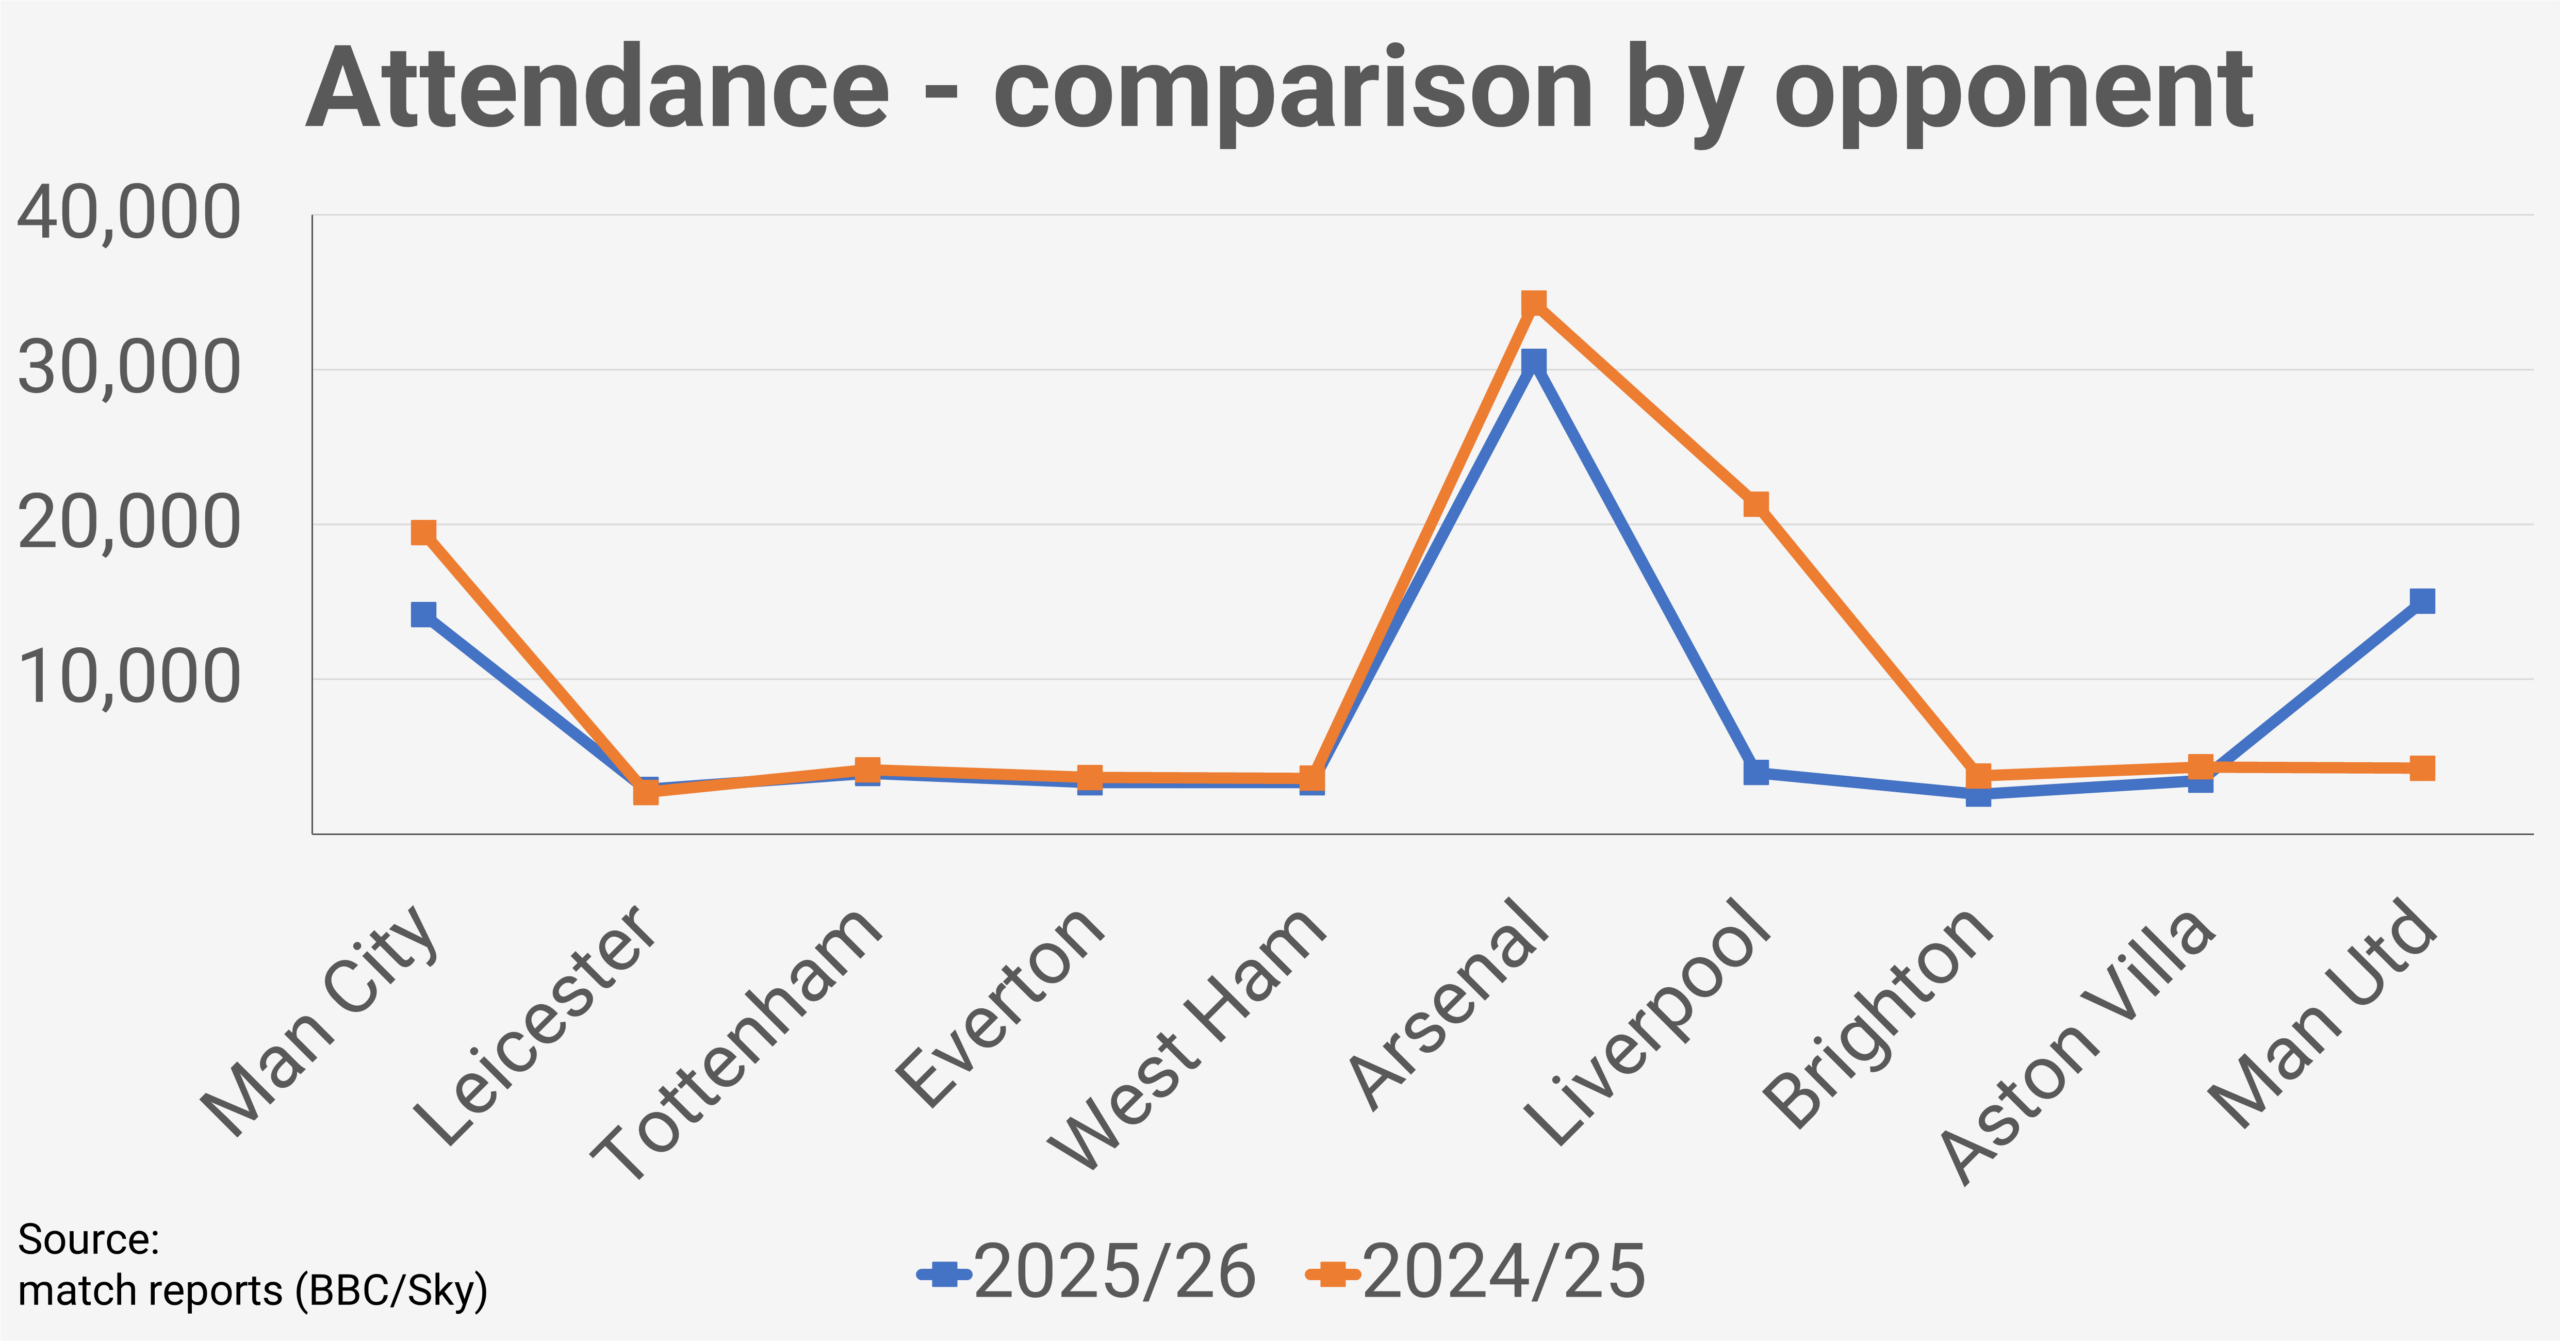
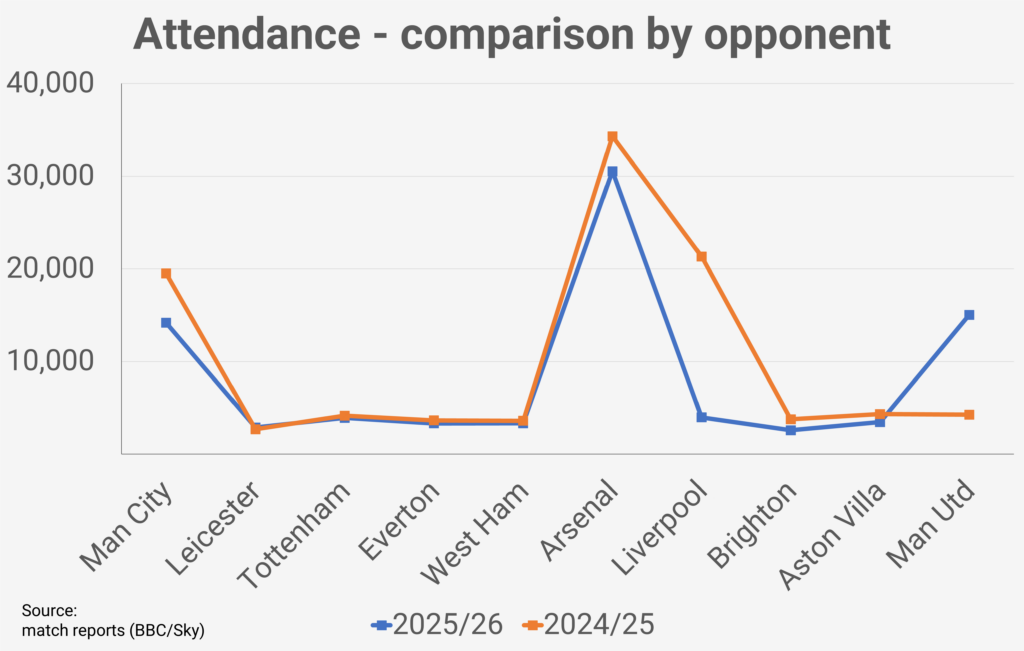
Manchester United played just one game at the club’s main stadium this season and as with other teams, the reduction in games at Old Trafford had a negative impact on their overall average which fell 16%.

While the attendance against Man City was 21% down on last season, the decision to play only this tie at the ground, saw the Old Trafford average rise by 24%.

Attendances at Leigh Sports Village started strongly. Their crowd of 8,665 against Arsenal set a new WSL record at the venue, and games against Leicester and Chelsea both saw year-on-year rises.

However, since November, attendances have fallen and despite an improvement on the last day against Brighton (4,067), ended 6% lower than 2024/25.
NOTE: The chart above displays attendances for the 2025/26 season in chronological order with comparisons to corresponding games in the 2024/25 season. Newly promoted London City Lionesses and Crystal Palace who were relegated from the WSL at the end of the 2024/25 season are omitted from the chart but are included in the attendance data.
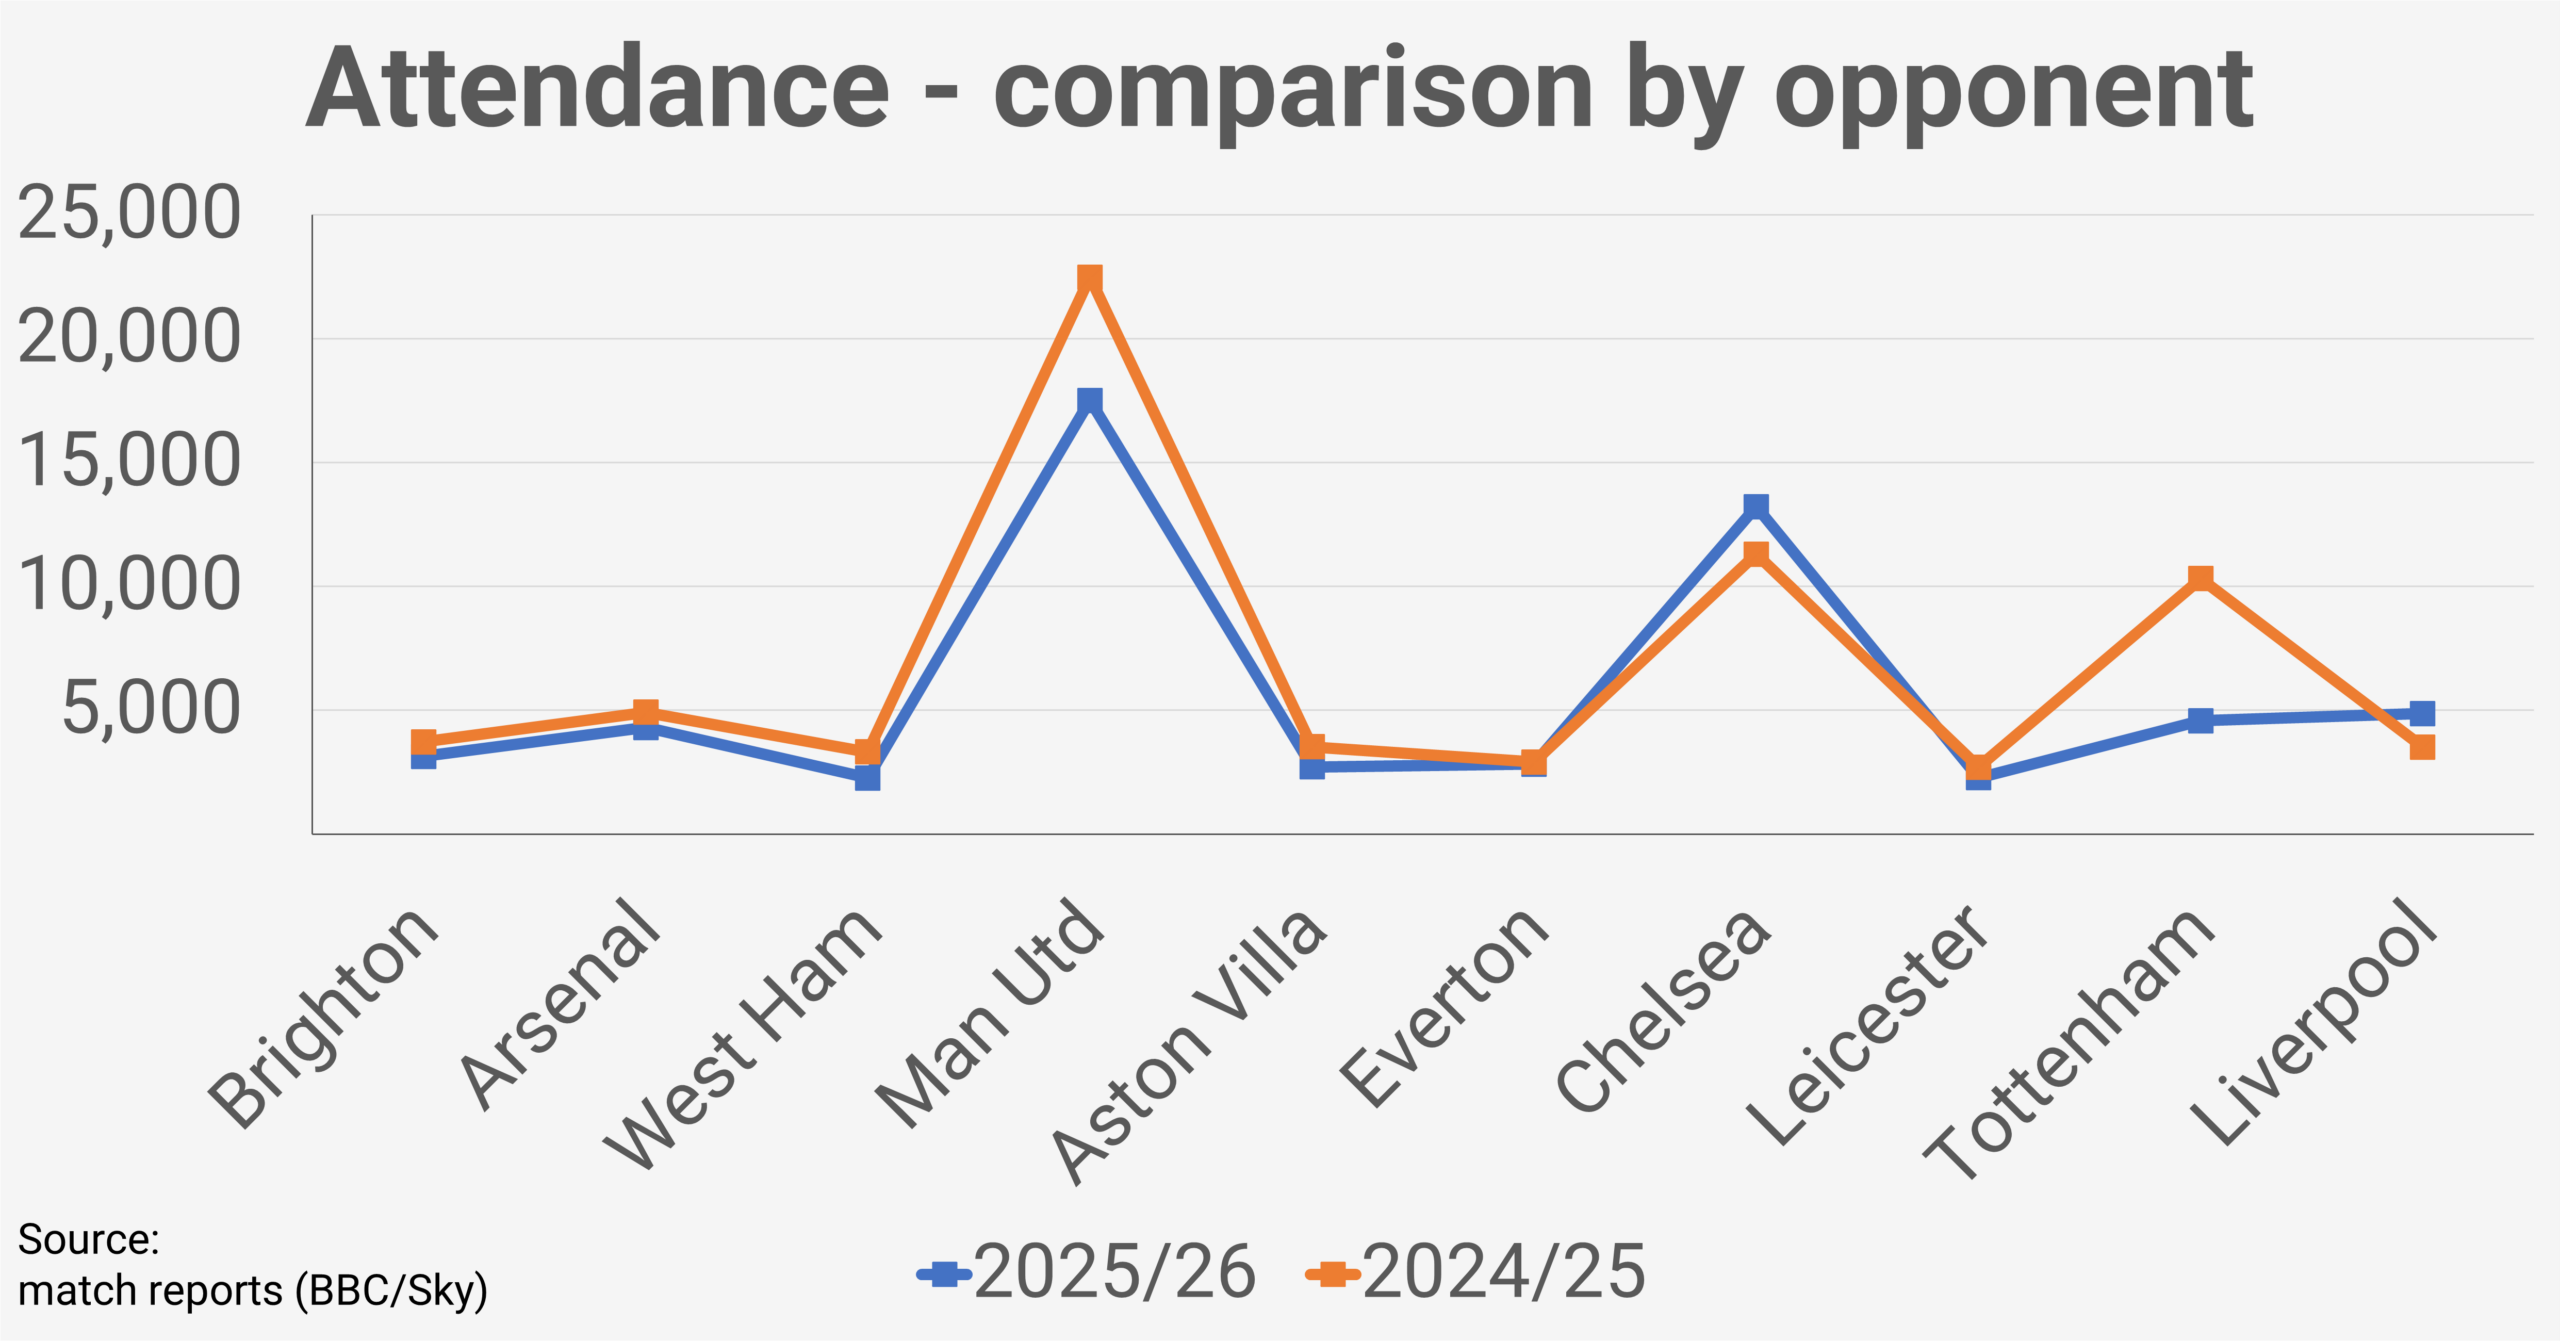
Chelsea attendance analysis – 2025/26

Stadium Games Total Average Change*
Kingsmeadow7/1123,4973,357-4%
Stamford Bridge4/1170,20817,552-30%
Total11/1193,7058,519-9%
Change* – 2025/26 average attendance compared to 2024/25.

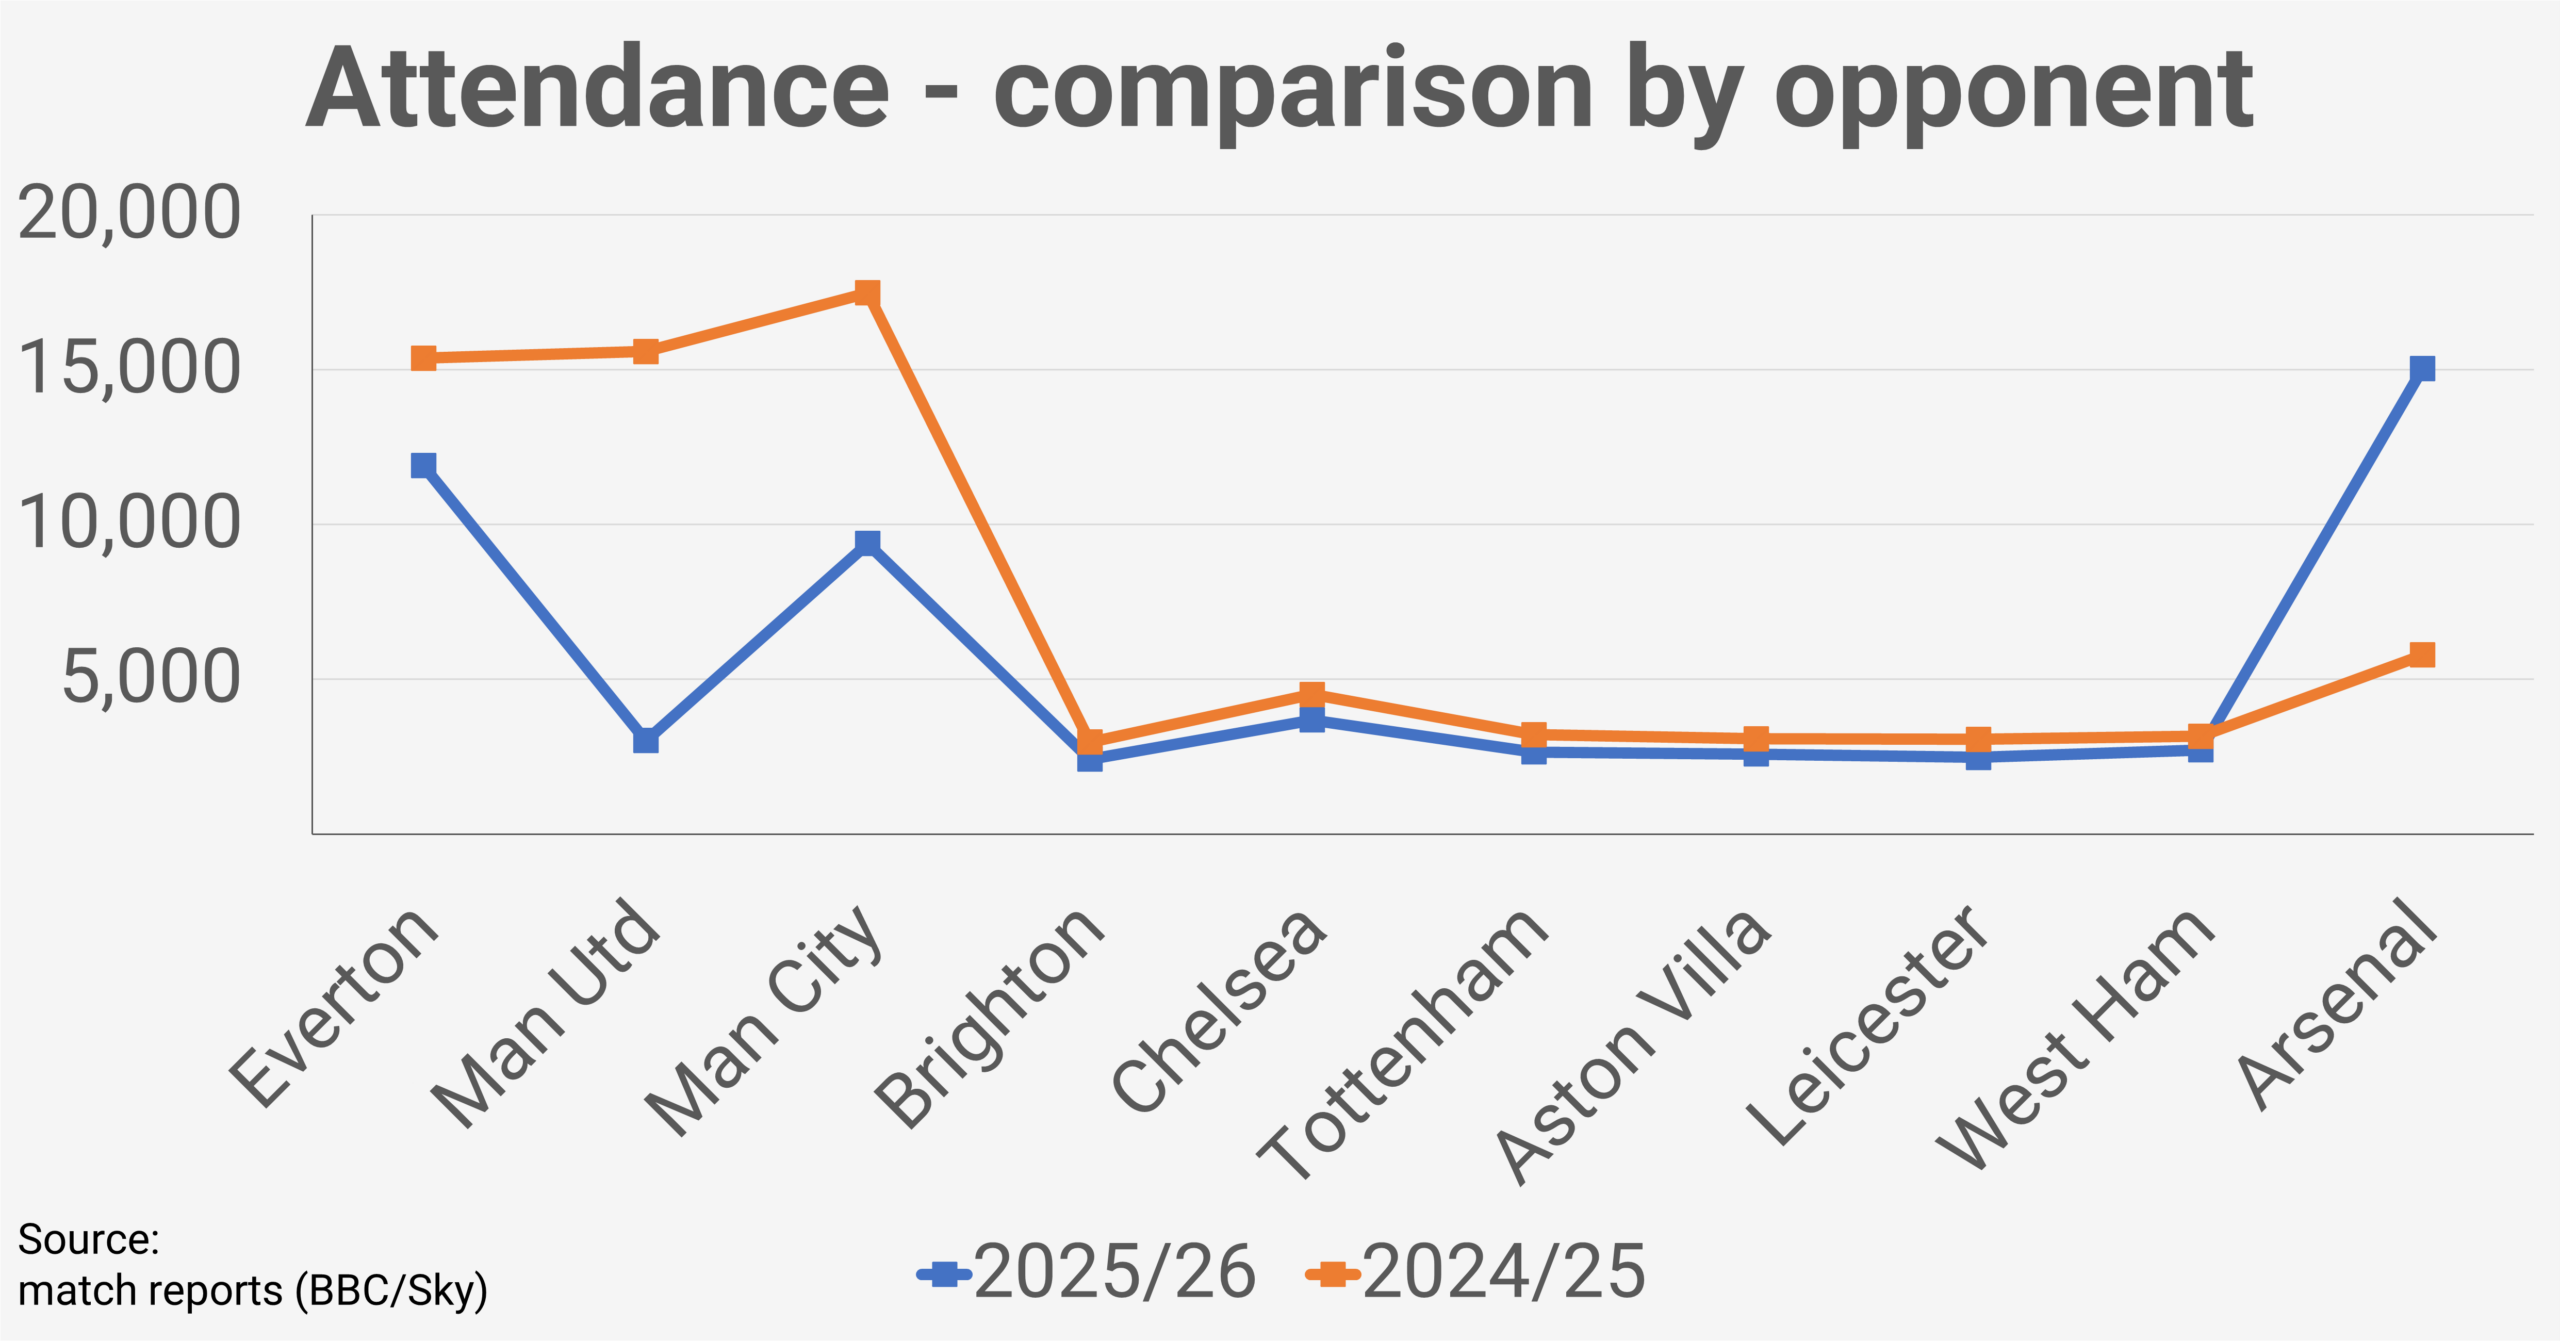
Chelsea staged four WSL fixtures at Stamford Bridge this season, hosting the other ‘big four’ sides and welcoming London City Lionesses in their first top‑flight campaign.

Games against Arsenal and Manchester City both drew smaller crowds than last season, and the final‑day meeting with Manchester United was also down on the last time that fixture was played at the stadium in 2023/24.

The London City Lionesses match attracted just over 10,000 fans, offering an early indication of the sort of attendances Chelsea might expect against less well‑supported opposition when they move to Stamford Bridge full‑time in 2026/27.

At Kingsmeadow, the first home game against Leicester delivered a 7% year‑on‑year increase, but most subsequent fixtures saw slight declines, leaving average attendances at the ground 4% down across the season.

NOTE: The chart above displays attendances for the 2025/26 season in chronological order with comparisons to corresponding games in the 2024/25 season. Newly promoted London City Lionesses and Crystal Palace who were relegated from the WSL at the end of the 2024/25 season are omitted from the chart but are included in the attendance data.
Liverpool attendance analysis – 2025/26

Stadium Games Total Average Change*
St Helens Stadium8/1121,9902,749-24%
Anfield3/1136,33812,113-25%
Total11/1158,3285,303-24%
Change* – 2025/26 average attendance compared to 2024/25.

For a second consecutive season, Liverpool held 3 games at Anfield.

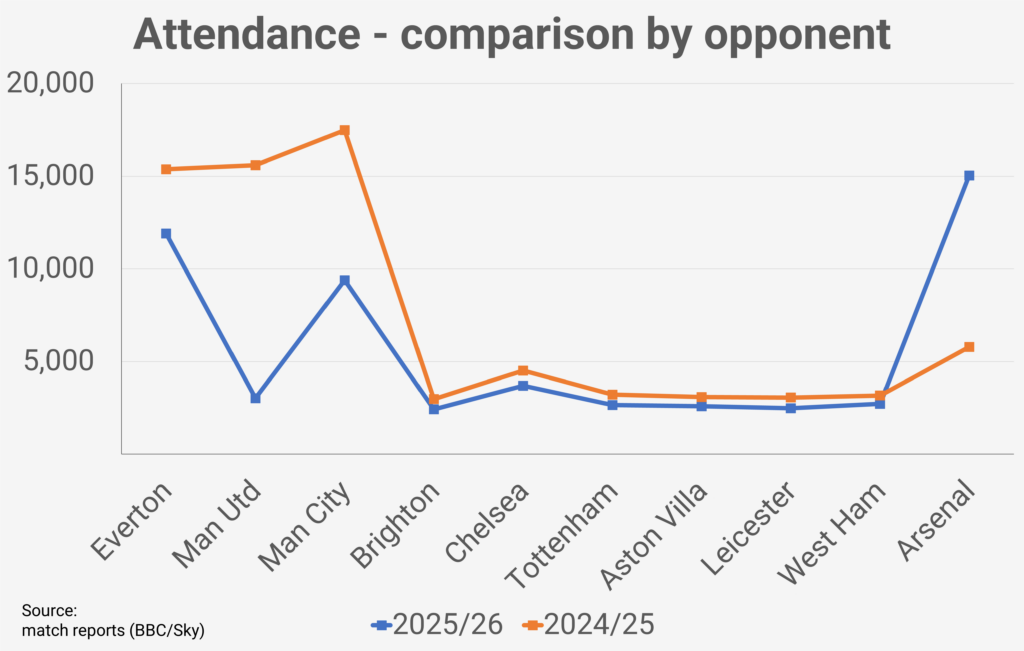
They started the season against local rivals Everton in a game which saw an attendance drop of over 20% compared to 2024/25.

The meeting with eventual champions – Manchester City in October, attracted 9,387 representing a 46% drop year-on-year.

However, their final game of the season against Arsenal, also held at the club’s main stadium, produced the club’s highest attendance of the season – 15,047.

Liverpool saw falls at their regular home – St Helen’s where attendances were consistently down by between 14-18% in the six matches with corresponding games in the 2024/25 season.

NOTE: The chart above displays attendances for the 2025/26 season in chronological order with comparisons to corresponding games in the 2024/25 season. Newly promoted London City Lionesses and Crystal Palace who were relegated from the WSL at the end of the 2024/25 season are omitted from the chart but are included in the attendance data.
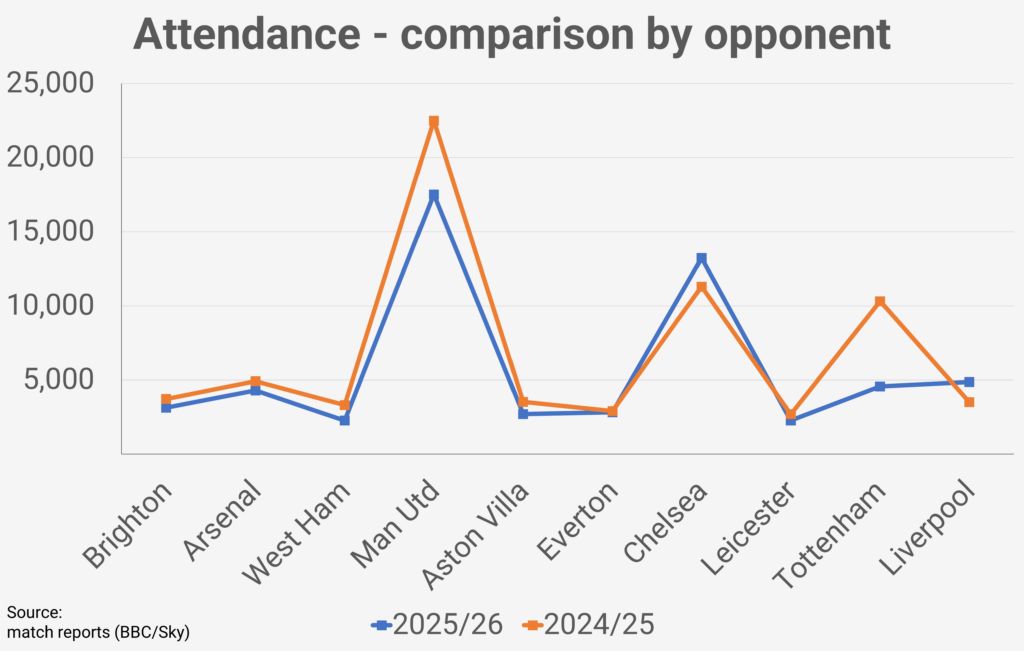
Tottenham attendance analysis – 2025/26

Stadium Games Total Average Change*
Brisbane Road8/1117,8042,22637%
Tottenham Hotspur Stadium3/1121,4827,161-53%
Total11/1139,2863,571-33%
Change* – 2025/26 average attendance compared to 2024/25.

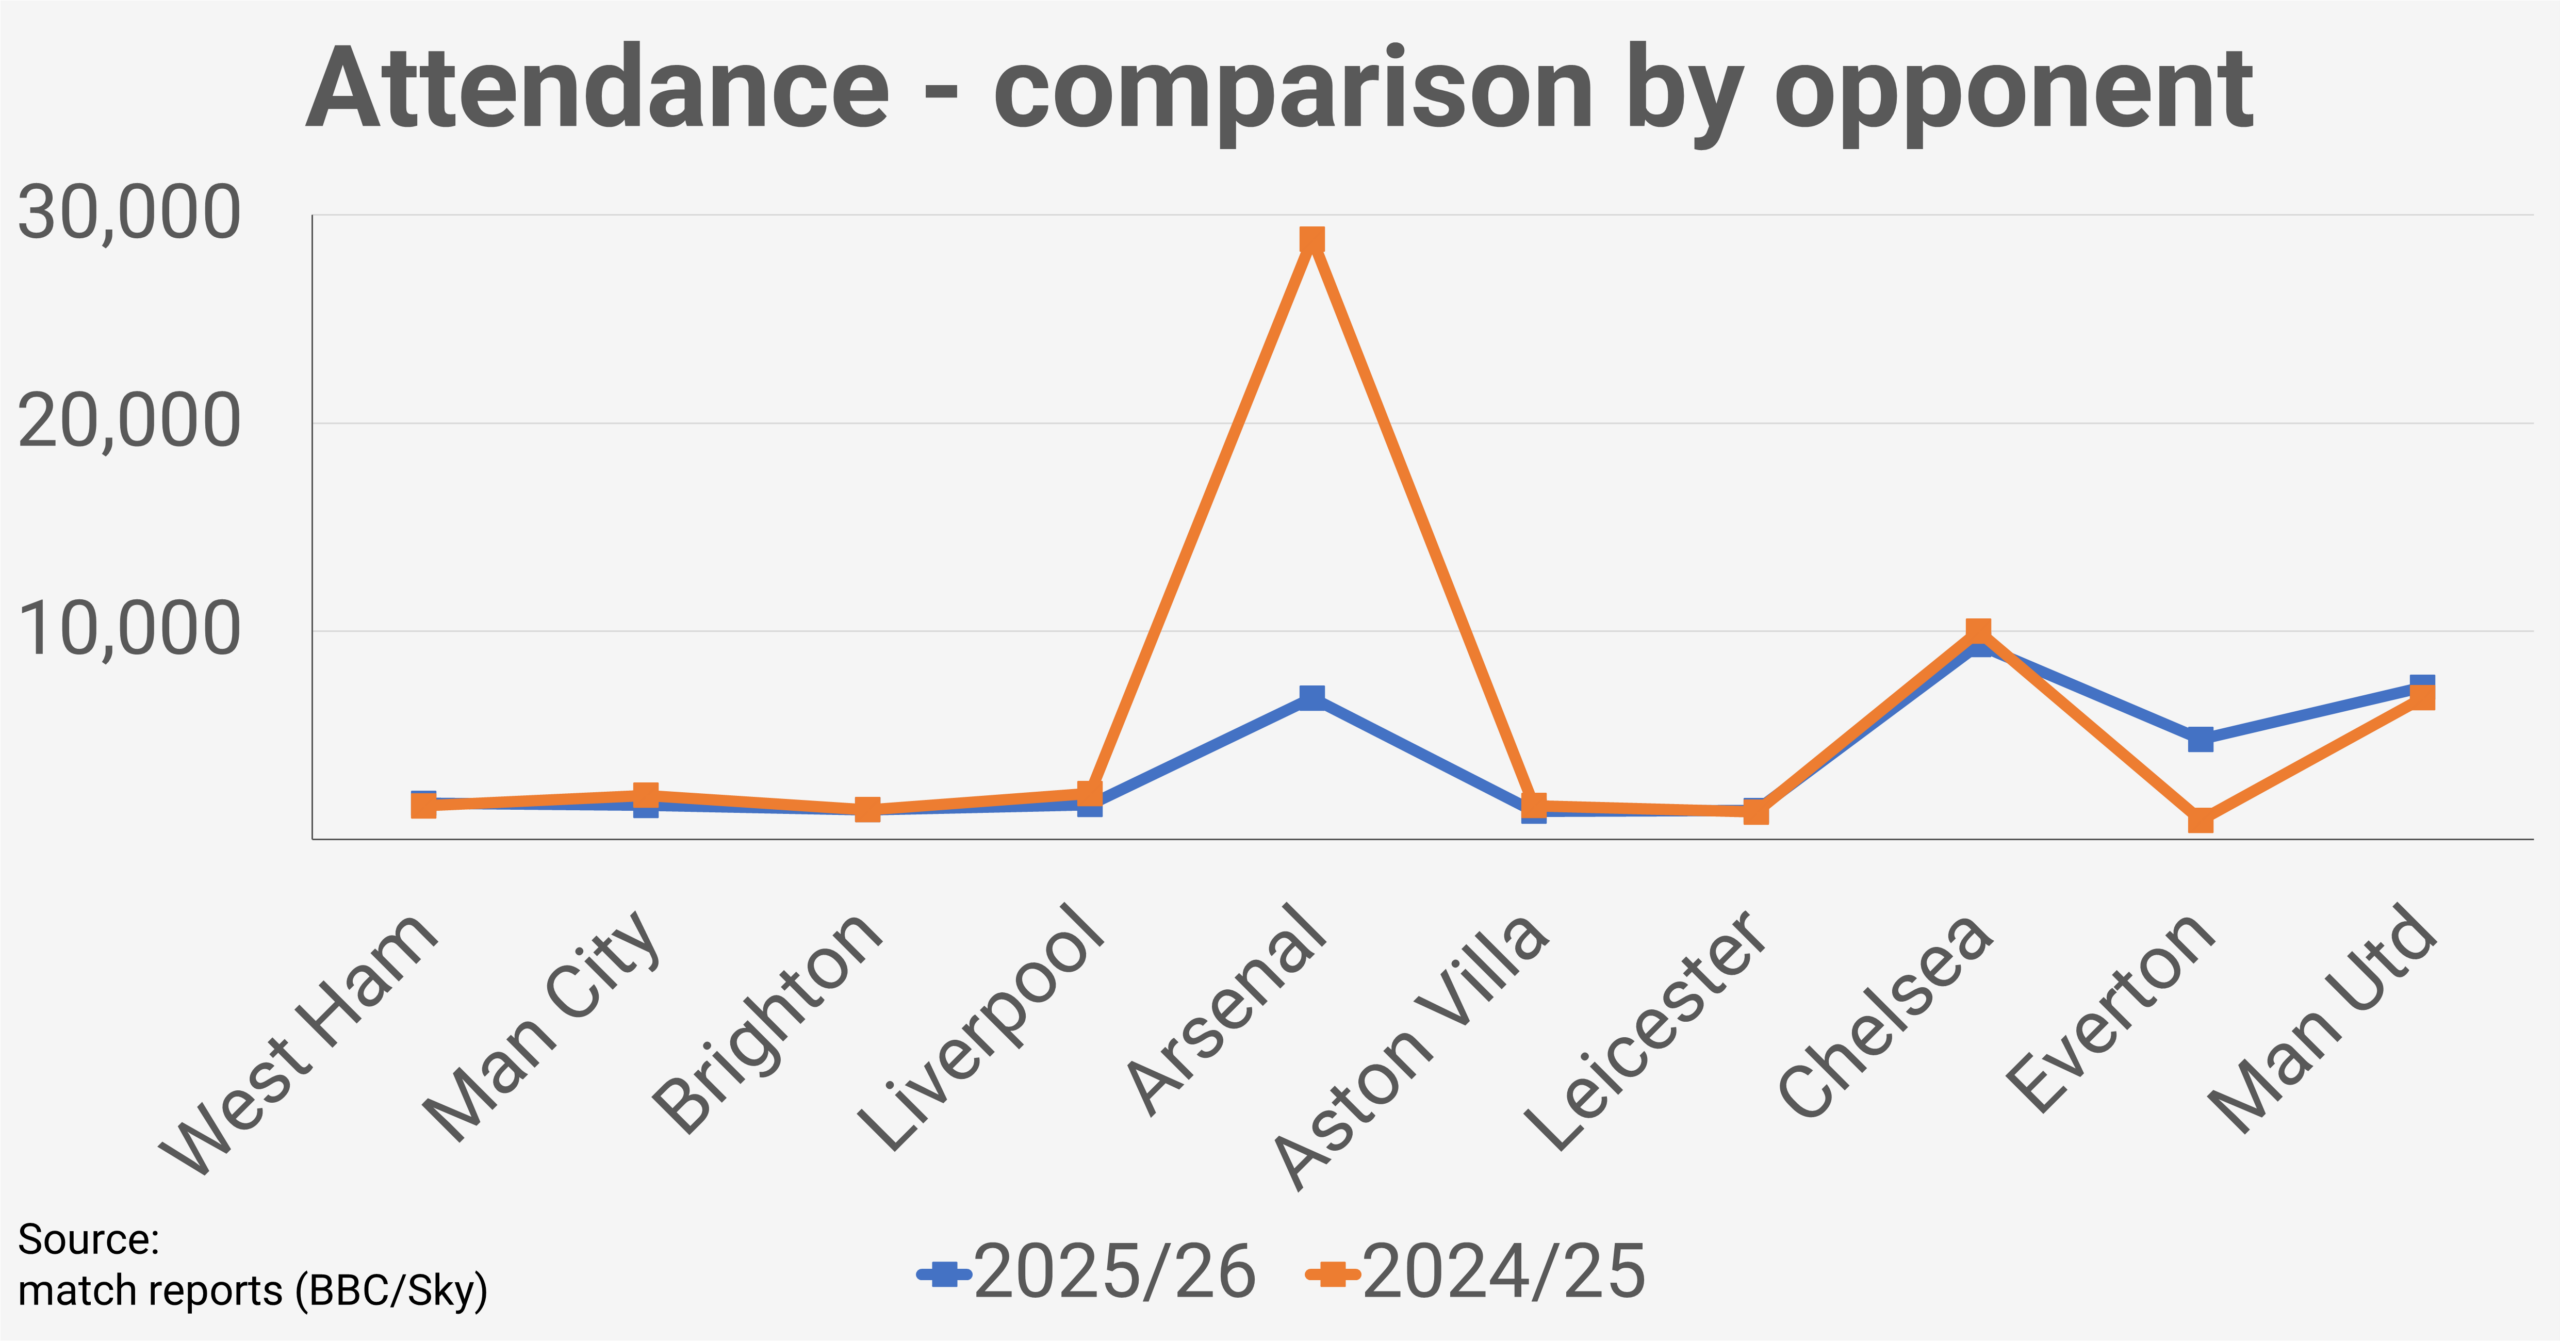
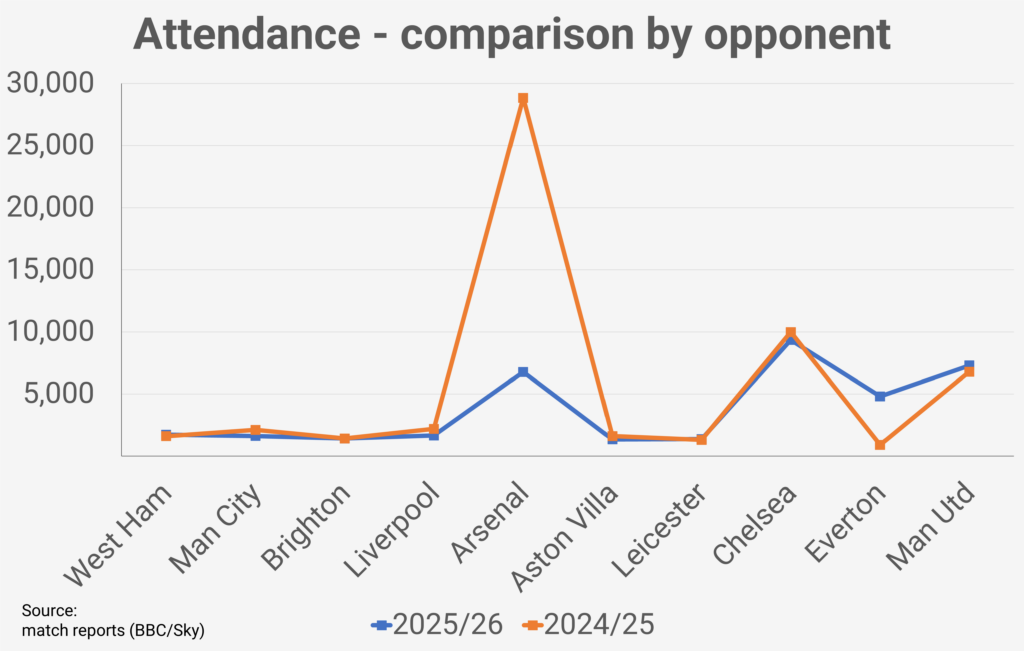
Tottenham saw the biggest overall drop in attendance in the WSL with a 33% drop on 2024/25.

However, this was largely due to the North London derby. Originally planned to take place at the Tottenham Hotspur stadium as it had in the previous 2 seasons, the game was moved to Brisbane Road and while it attracted the highest ever attendance at that stadium (6,788) this was considerably less than the 28,852 that attended the tie in the previous season.

Tottenham did play 3 games at the Tottenham stadium in 2025/26. Games against Chelsea and Manchester United drew very similar crowds to the 2024/25 season while the meeting with Everton saw one of their lowest attendances at the stadium.

Attendances at Brisbane Road were up 37% year-on-year but again, this was largely down to the Arsenal game. If we exclude that and look at averages across 2025/26 and the previous season, attendances dropped by 3%.

NOTE: The chart above displays attendances for the 2025/26 season in chronological order with comparisons to corresponding games in the 2024/25 season. Newly promoted London City Lionesses and Crystal Palace who were relegated from the WSL at the end of the 2024/25 season are omitted from the chart but are included in the attendance data.
West Ham attendance analysis – 2025/26

Stadium Games Total Average Change*
Chigwell Construction Stadium11/1118,7251,702-7%
London Stadium0/11n/a00%
Total11/1118,7251,702-7%
Change* – 2025/26 average attendance compared to 2024/25.

Having last played at the London Stadium in 2019/20, West Ham again staged all their home games at the Chigwell Construction Stadium and finished the season with attendances 7% down on 2024/25.

They opened strongly, recording their third highest ever WSL crowd for the visit of Arsenal (3,483), followed by a Chelsea fixture that dipped just 2% year on year.

The picture changed after two heavy defeat and from that point through to April, attendances fell away, averaging 24% lower than the previous season. The low point came with just 1,097 fans for the visit of Manchester United – a 56% drop on the previous campaign, with a 19:30 Wednesday kick off certainly having an impact.

Even so, West Ham ended on a positive note. Their final home match brought a crowd of 2,774 for Manchester City, their second highest attendance of the season and a much-needed lift to close out the campaign.

NOTE: The chart above displays attendances for the 2025/26 season in chronological order with comparisons to corresponding games in the 2024/25 season. Newly promoted London City Lionesses and Crystal Palace who were relegated from the WSL at the end of the 2024/25 season are omitted from the chart but are included in the attendance data.
Everton attendance analysis – 2025/26

Stadium Games Total Average Change*
Goodison Park10/1135,2403,524231%
Hill Dickinson Stadium1/1118,15418,154204%
Total11/1153,3944,854148%
Change* – 2025/26 average attendance compared to 2024/25. Goodison Park, the team’s new ‘regular’ stadium compared to Walton Hall Park. Hill Dickinson stadium, the club’s new ‘main’ stadium compared to Goodison Park

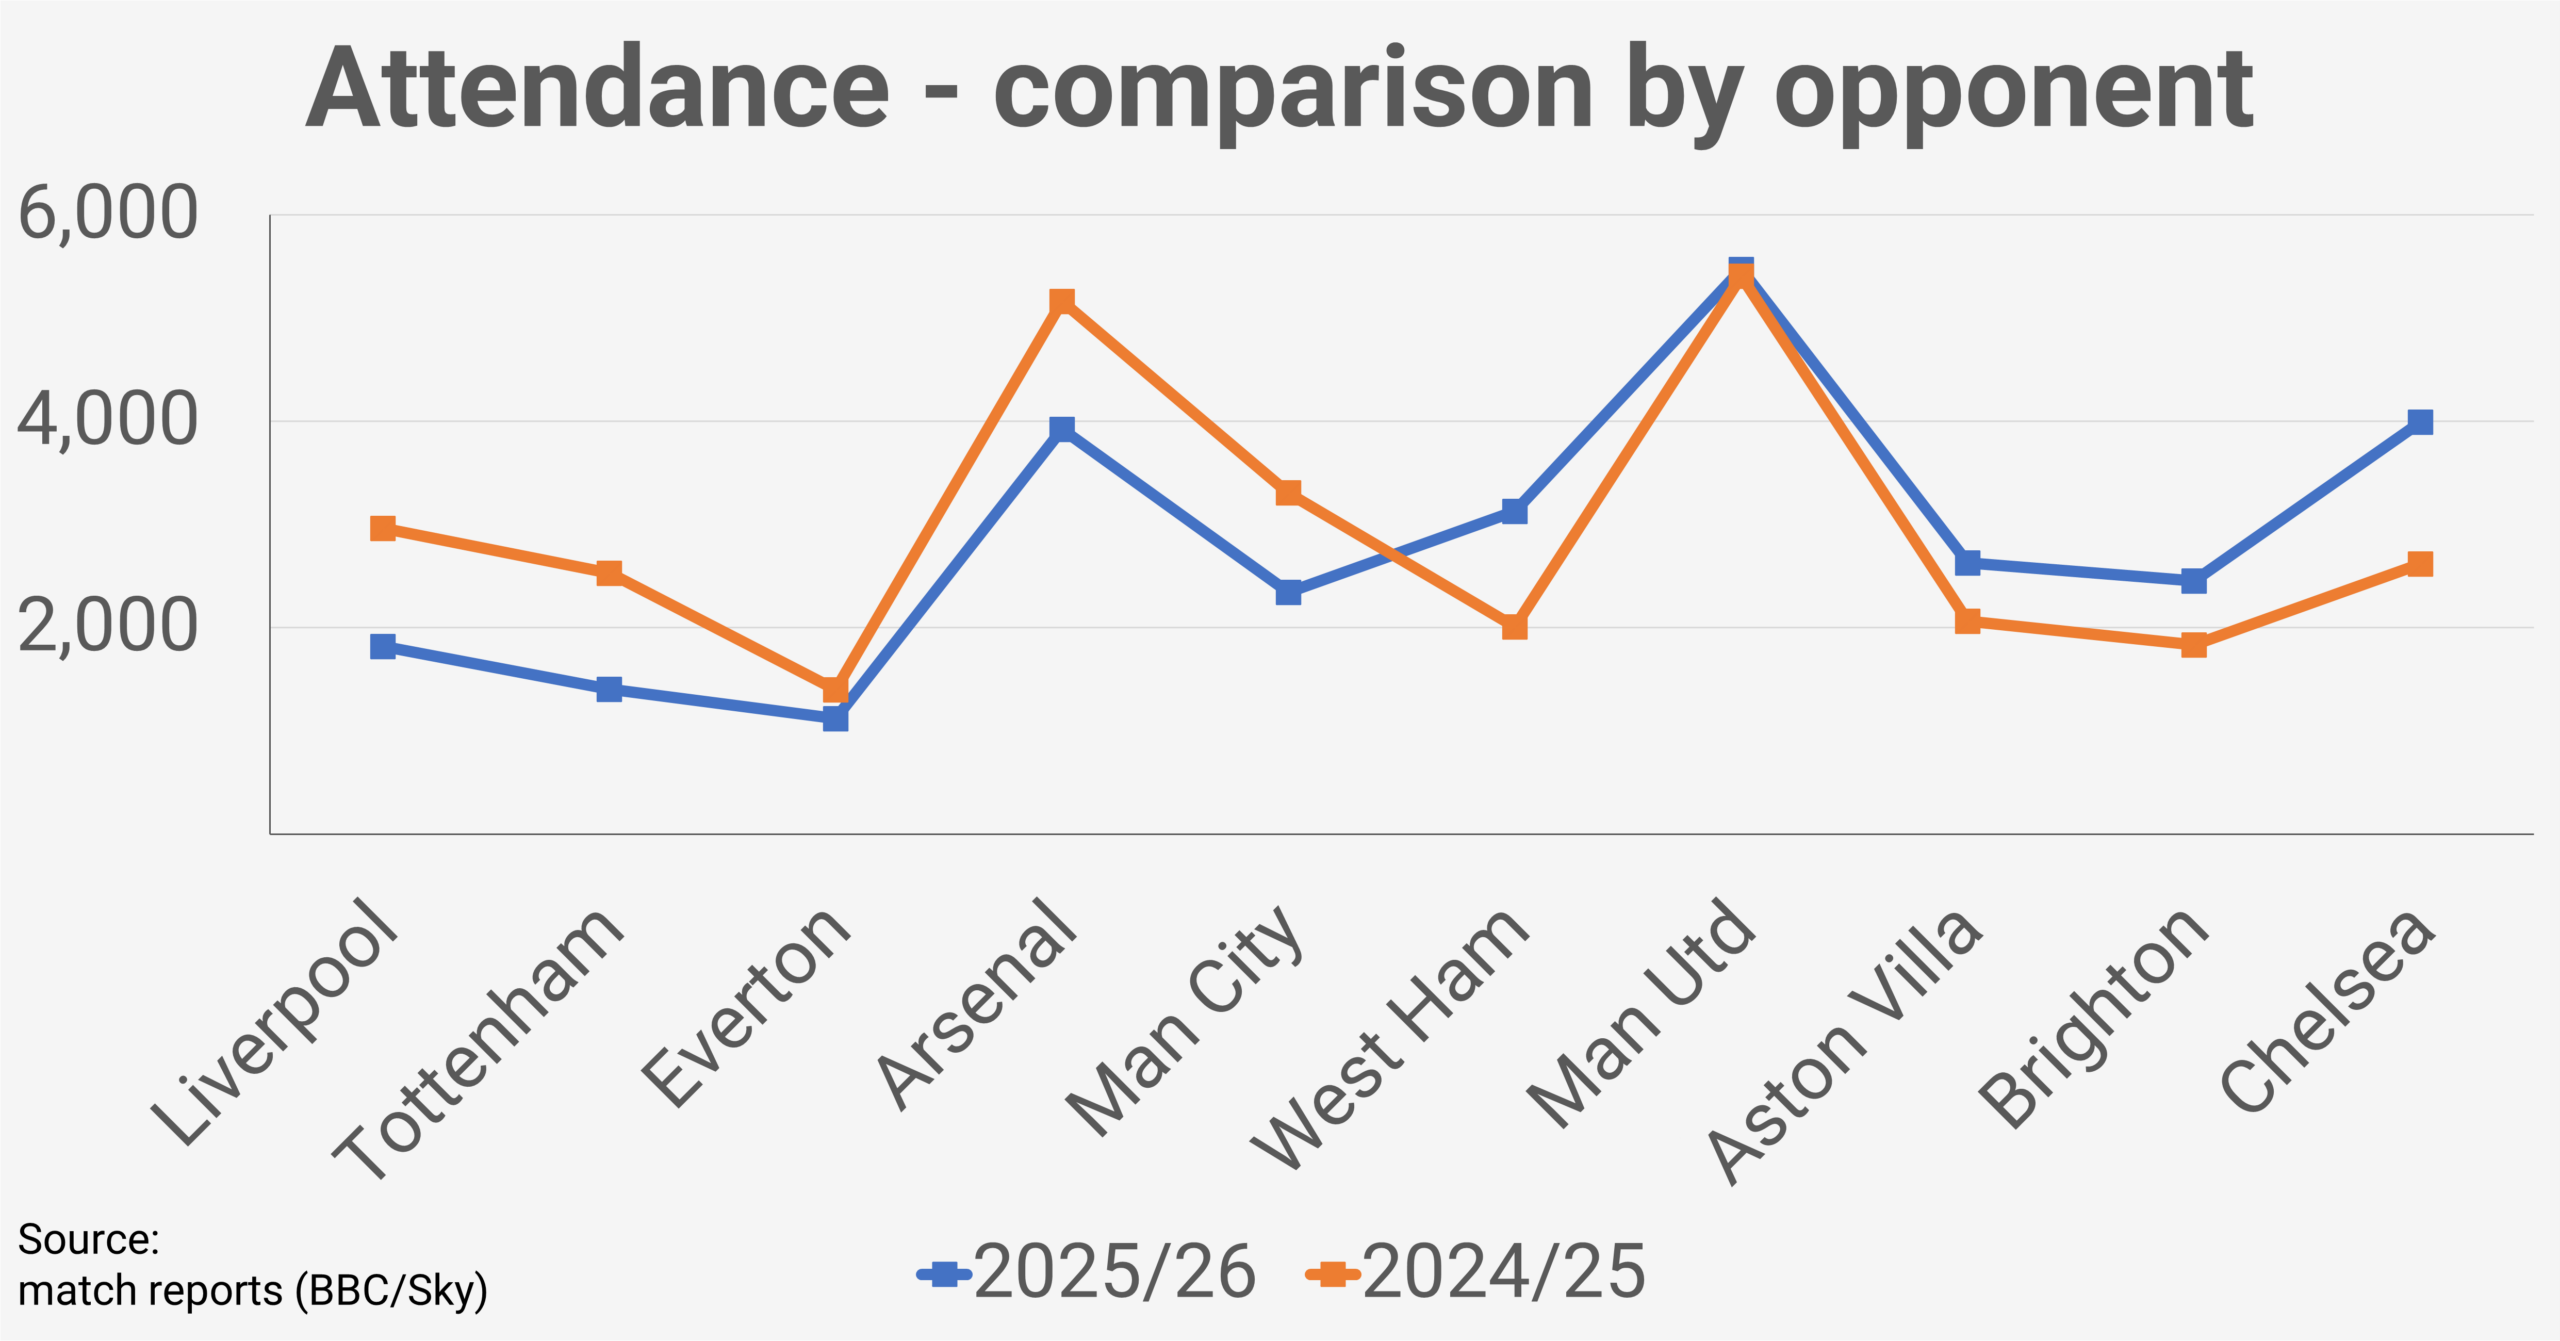
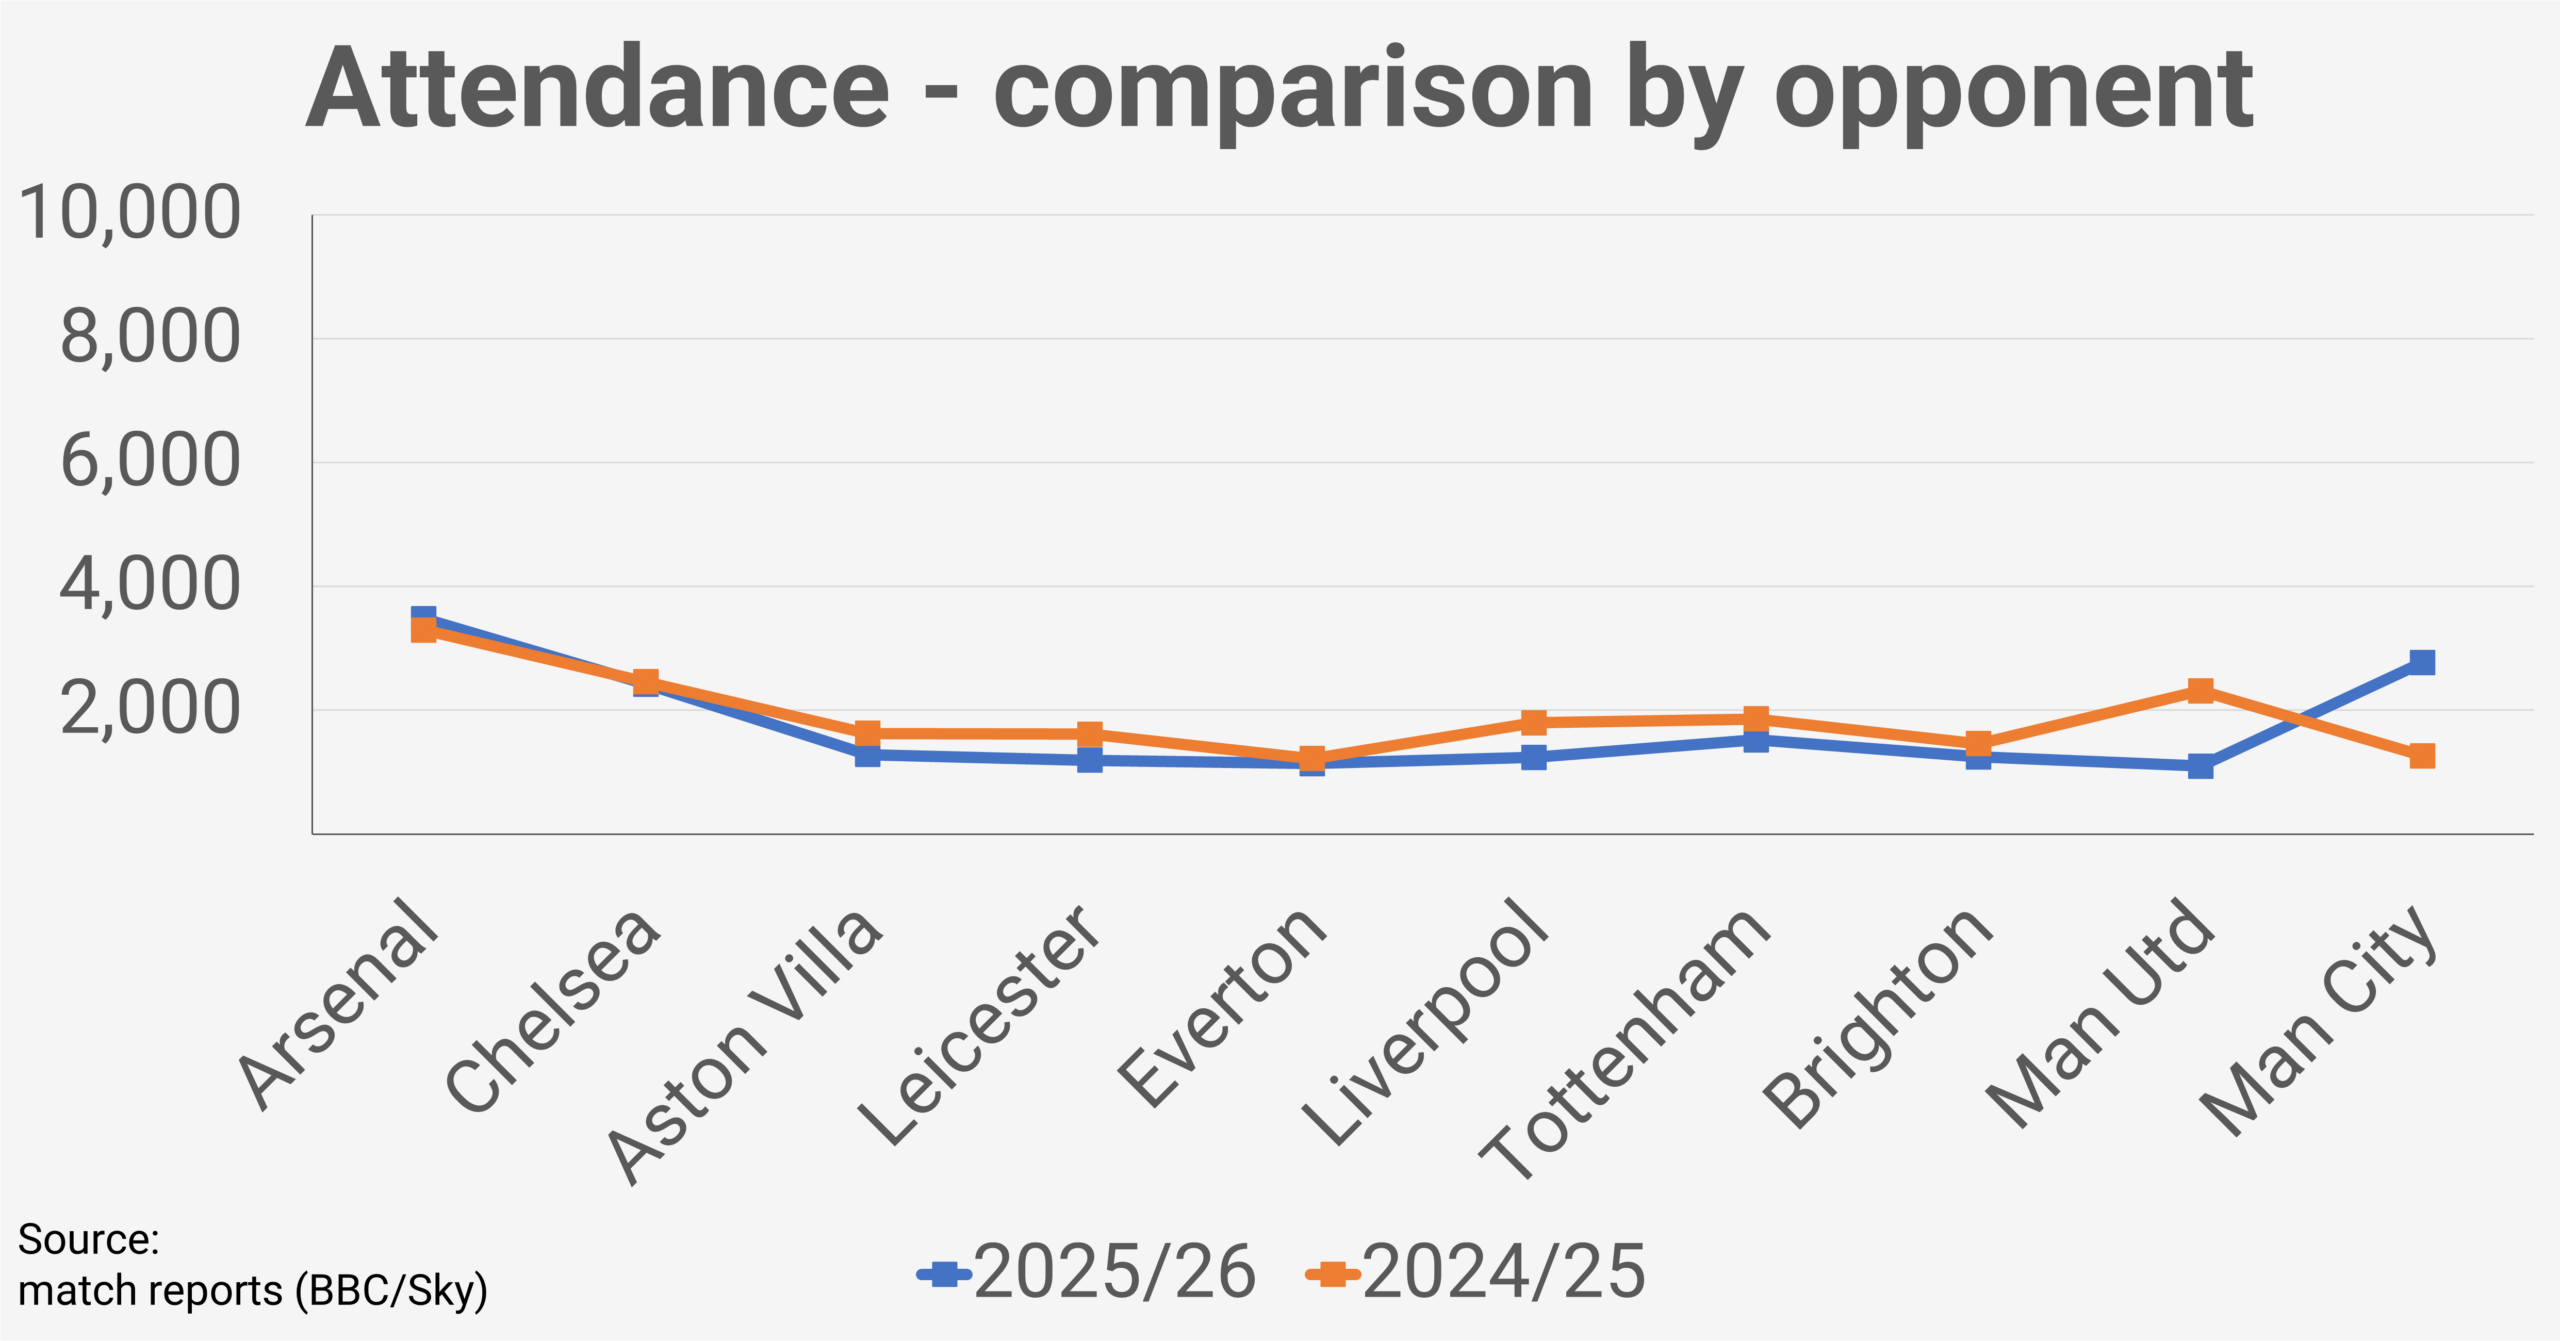
Everton’s move to Goodison Park has had a huge impact on attendances with their average up 231% on their previous regular ground – Walton Hall Park.

Their opening game drew a crowd of over 6,400 for the visit of Tottenham, an attendance that proved to be the highest of the season at their new home.

A number of high-profile opponents kept attendances strong in the first half of the season and despite poor form on the pitch, their average going into the winter break stood at 4,543.

While results improved as the league returned, attendances struggled. The derby against Liverpool was the only other game to break the 5,000 barrier and saw an almost 50% drop on last season. Average attendance across the second half of the season fell to 2,845.

Opting to host an early‑season game at the newly opened Hill Dickinson Stadium was a shrewd move by the club. Everton attracted their 2nd highest attendance ever for the visit of Manchester United which contributed to an overall 148% increase in overall attendance year-on-year.

NOTE: The chart above displays attendances for the 2025/26 season in chronological order with comparisons to corresponding games in the 2024/25 season. Newly promoted London City Lionesses and Crystal Palace who were relegated from the WSL at the end of the 2024/25 season are omitted from the chart but are included in the attendance data.
London City Lionesses attendance analysis – 2025/26

Stadium Games Total Average Change*
Hayes Lane10/1130,1193,012n/a
The Den1/114,8204,820n/a
Total11/1134,9393,176n/a
Change* – 2025/26 average attendance compared to 2024/25.

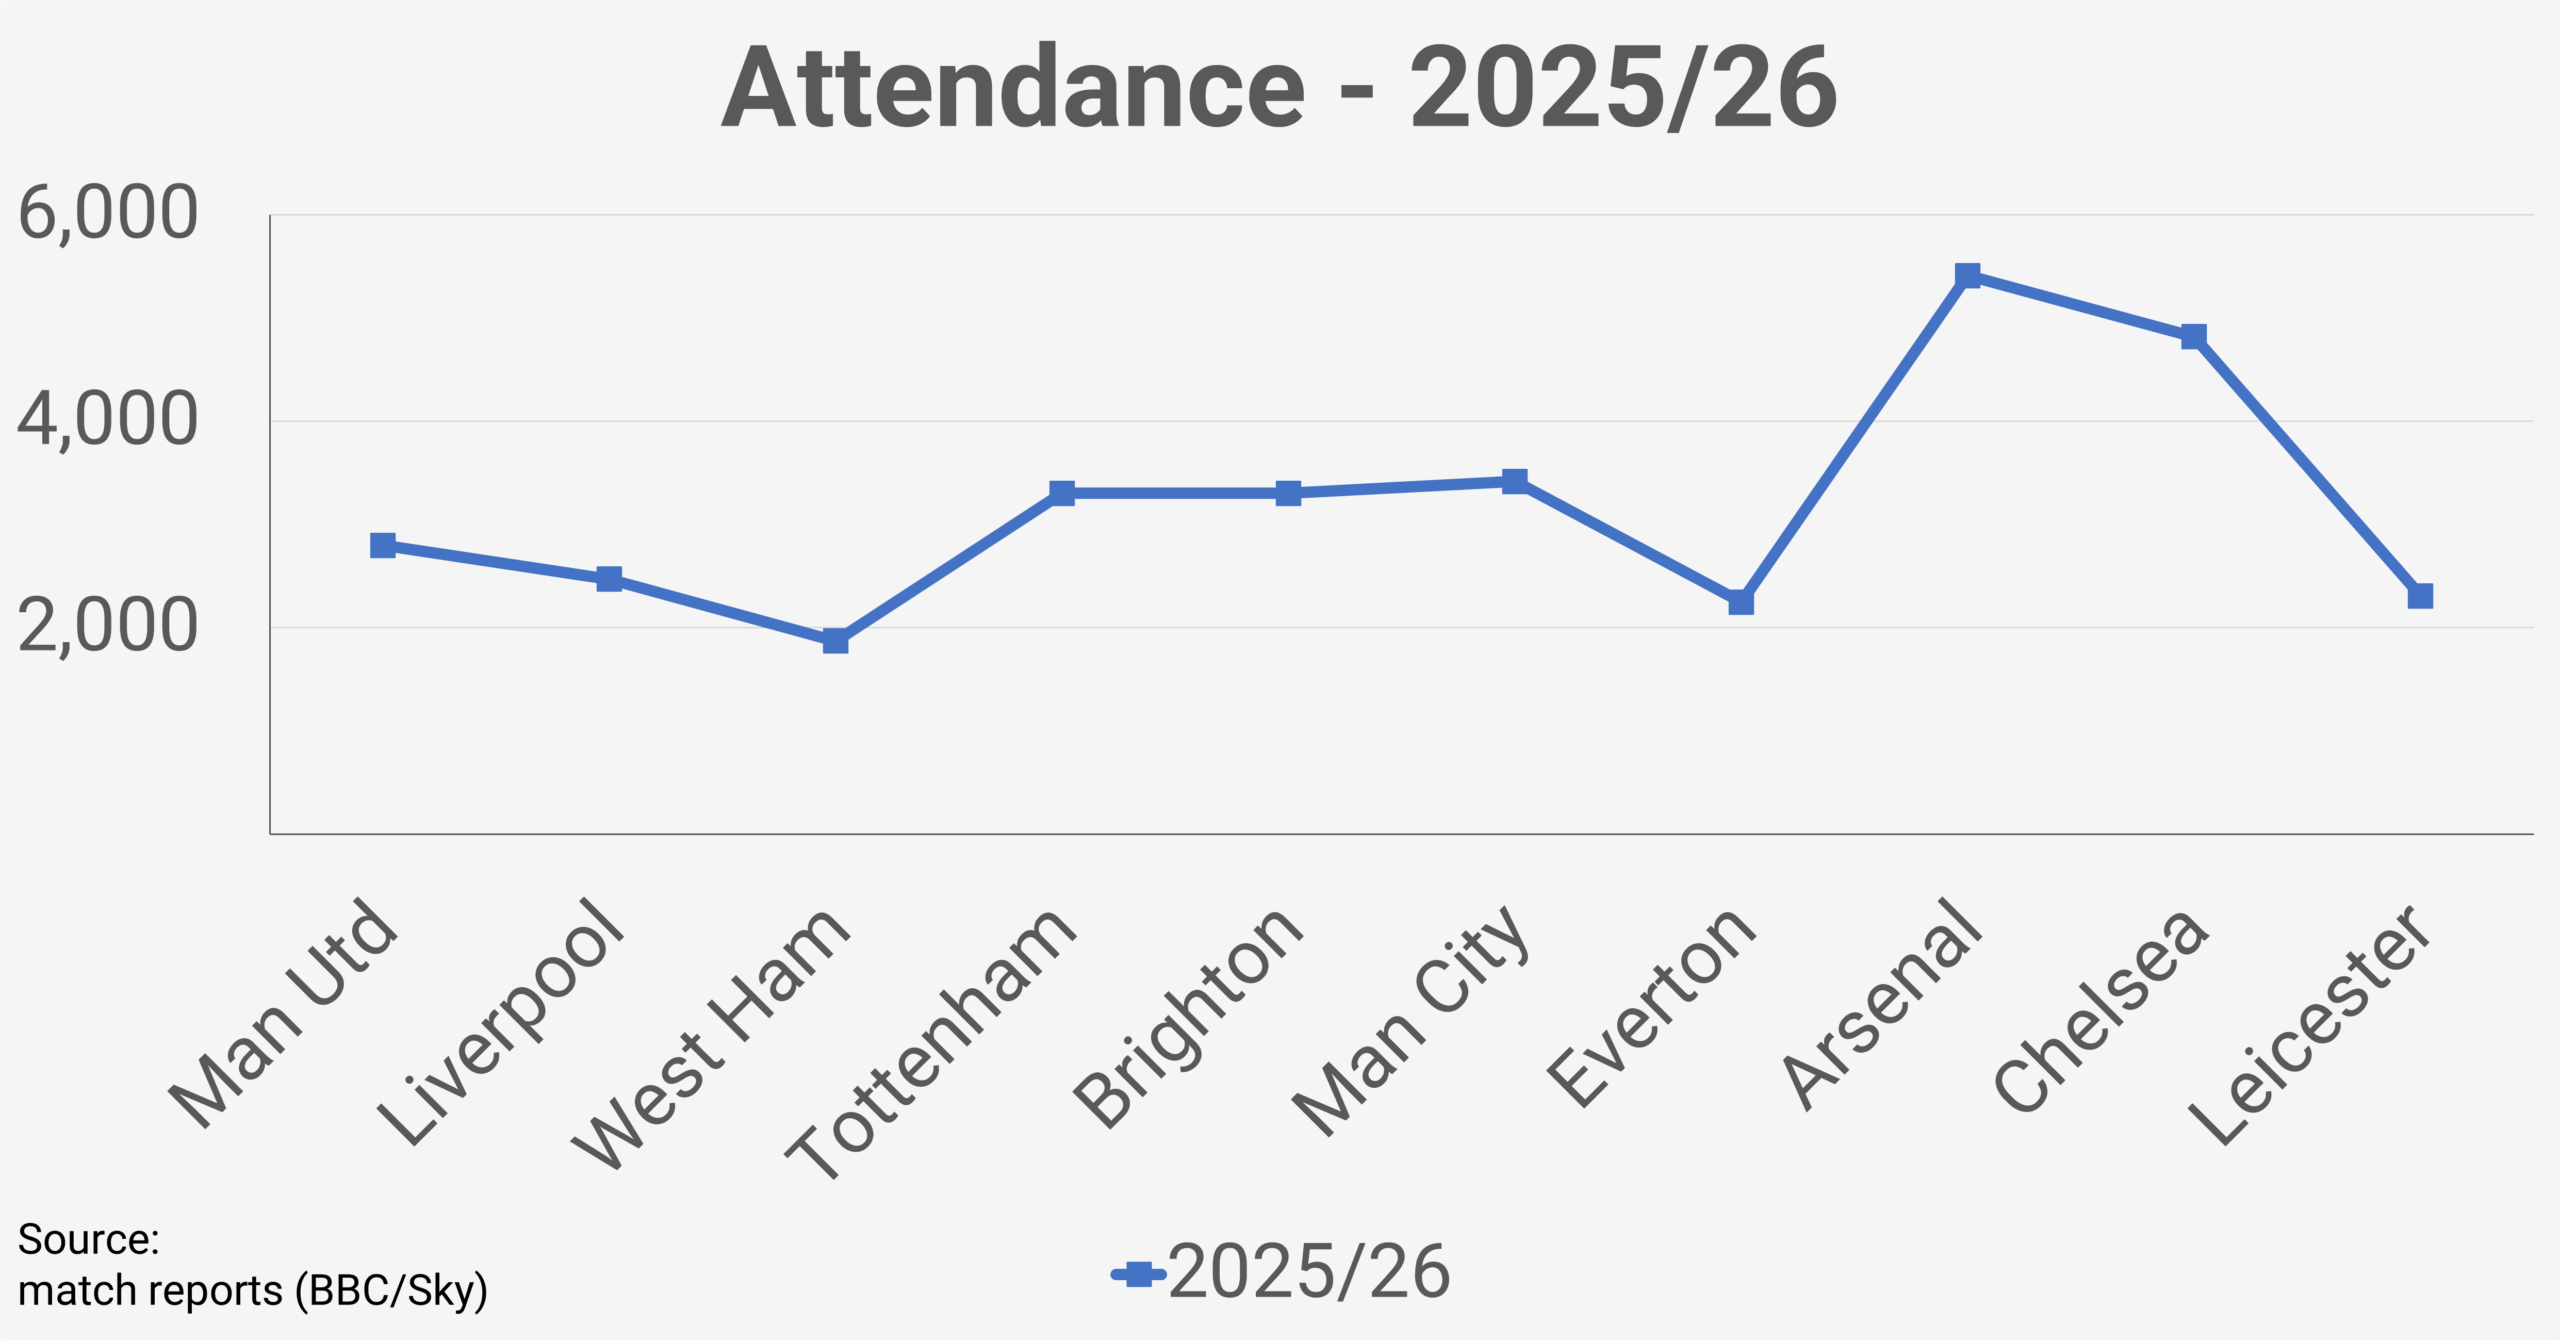
London City more than doubled their average attendance to 3,176 after promotion from WSL2

In their first WSL season, and without the established support of a parent club — they’ve posted crowds that put them above established sides such as Brighton, Leicester and West Ham.

Hayes Road’s attendance record has been broken several times, helped in part by their location. The season high 5,414 came against Arsenal, with a sizeable away following contributing to the total.

The most debated fixture of the season — the game moved to The Den — was also against London opposition. The visit of Chelsea drew 4,820, London City’s second‑highest crowd of the campaign.

NOTE: The chart above displays attendances for the 2025/26 season in chronological order.

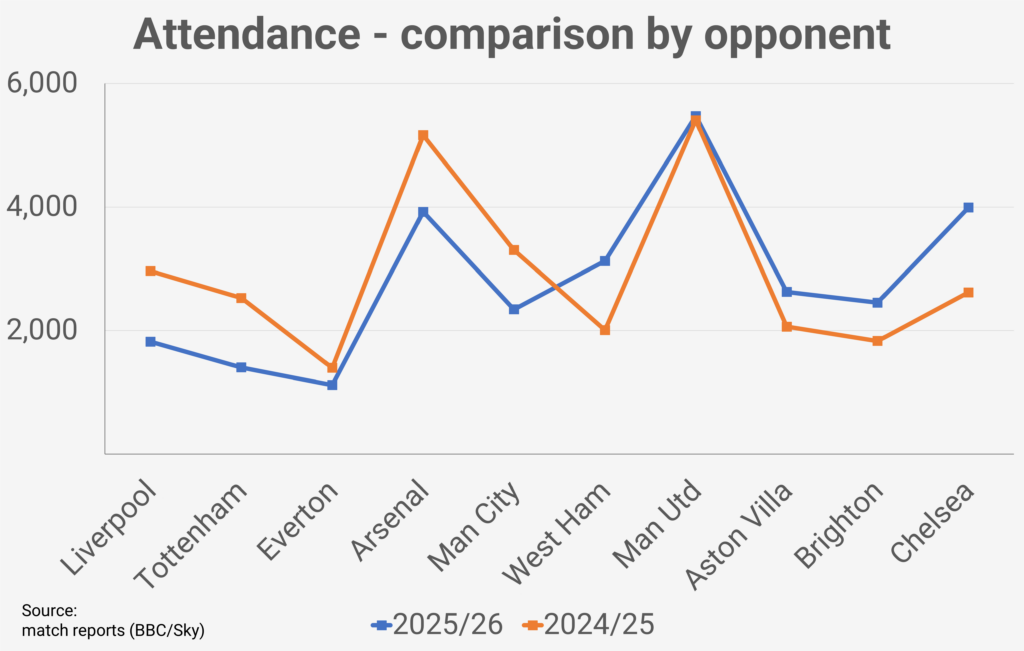
Leicester attendance analysis – 2025/26

Stadium Games Total Average Change*
Pirelli Stadium0/11n/an/an/a
King Power Stadium11/1130,5352,776-2%
Total11/1130,5352,776-2%
Change* – 2025/26 average attendance compared to 2024/25.

For a second consecutive season, Leicester played all their home matches at the King Power Stadium, with average attendances falling by 2% compared to 2024/25.

The campaign got off to a slow start when every home fixture in the first half of the season drew a smaller crowd than the corresponding match the previous year, averaging a 30% year‑on‑year decline.

However, despite their disappointing season on the pitch, attendances improved considerably after the January transfer window. This period coincided with the high‑profile arrival of Alisha Lehmann, and from the winter break onwards home crowds were 65% higher. While this included their season‑best 5,474 against Manchester United, the subsequent fixtures drew attendances at least 25% higher than the equivalent games in 2024/25.

NOTE: The chart above displays attendances for the 2025/26 season in chronological order with comparisons to corresponding games in the 2024/25 season. Newly promoted London City Lionesses and Crystal Palace who were relegated from the WSL at the end of the 2024/25 season are omitted from the chart but are included in the attendance data.
Manchester City attendance analysis – 2025/26

Stadium Games Total Average Change*
Joie Stadium9/1130,3083,368-3%
Etihad Stadium2/1130,74815,3745%
Total11/1161,0565,551-15%
Change* – 2025/26 average attendance compared to 2024/25.

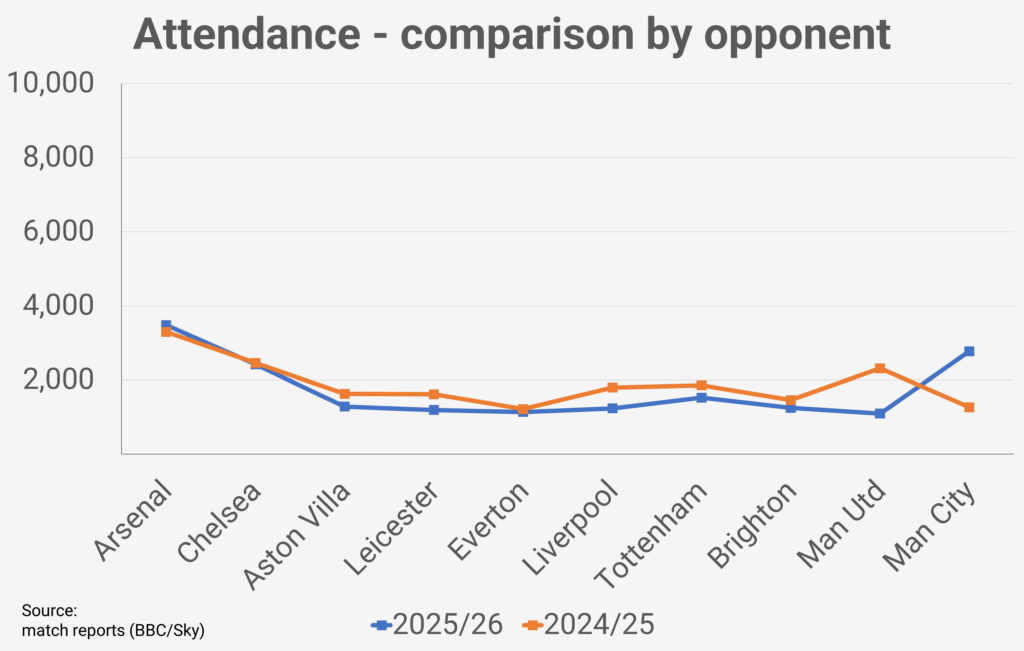
Manchester City played one game fewer at the Etihad Stadium than in 2024/25, which was the key factor behind the 15% overall drop in average attendances.

While the derby against Manchester United saw a fall of 22%, their meeting with Chelsea saw a 17% rise compared to last season and the club’s focus on playing just these two high-profile games resulted in a 5% rise in average attendance at the club’s main stadium in 2025/26.

Despite their success on the field, attendances at the Joie Stadium didn’t follow suit and up until March, average crowds were 15% down year-on-year.

However, as they closed in on the title, games against Tottenham and Liverpool both attracted over 4,500 fans and average attendances at the venue finished just 3% down on the previous season.

NOTE: The chart above displays attendances for the 2025/26 season in chronological order with comparisons to corresponding games in the 2024/25 season. Newly promoted London City Lionesses and Crystal Palace who were relegated from the WSL at the end of the 2024/25 season are omitted from the chart but are included in the attendance data.
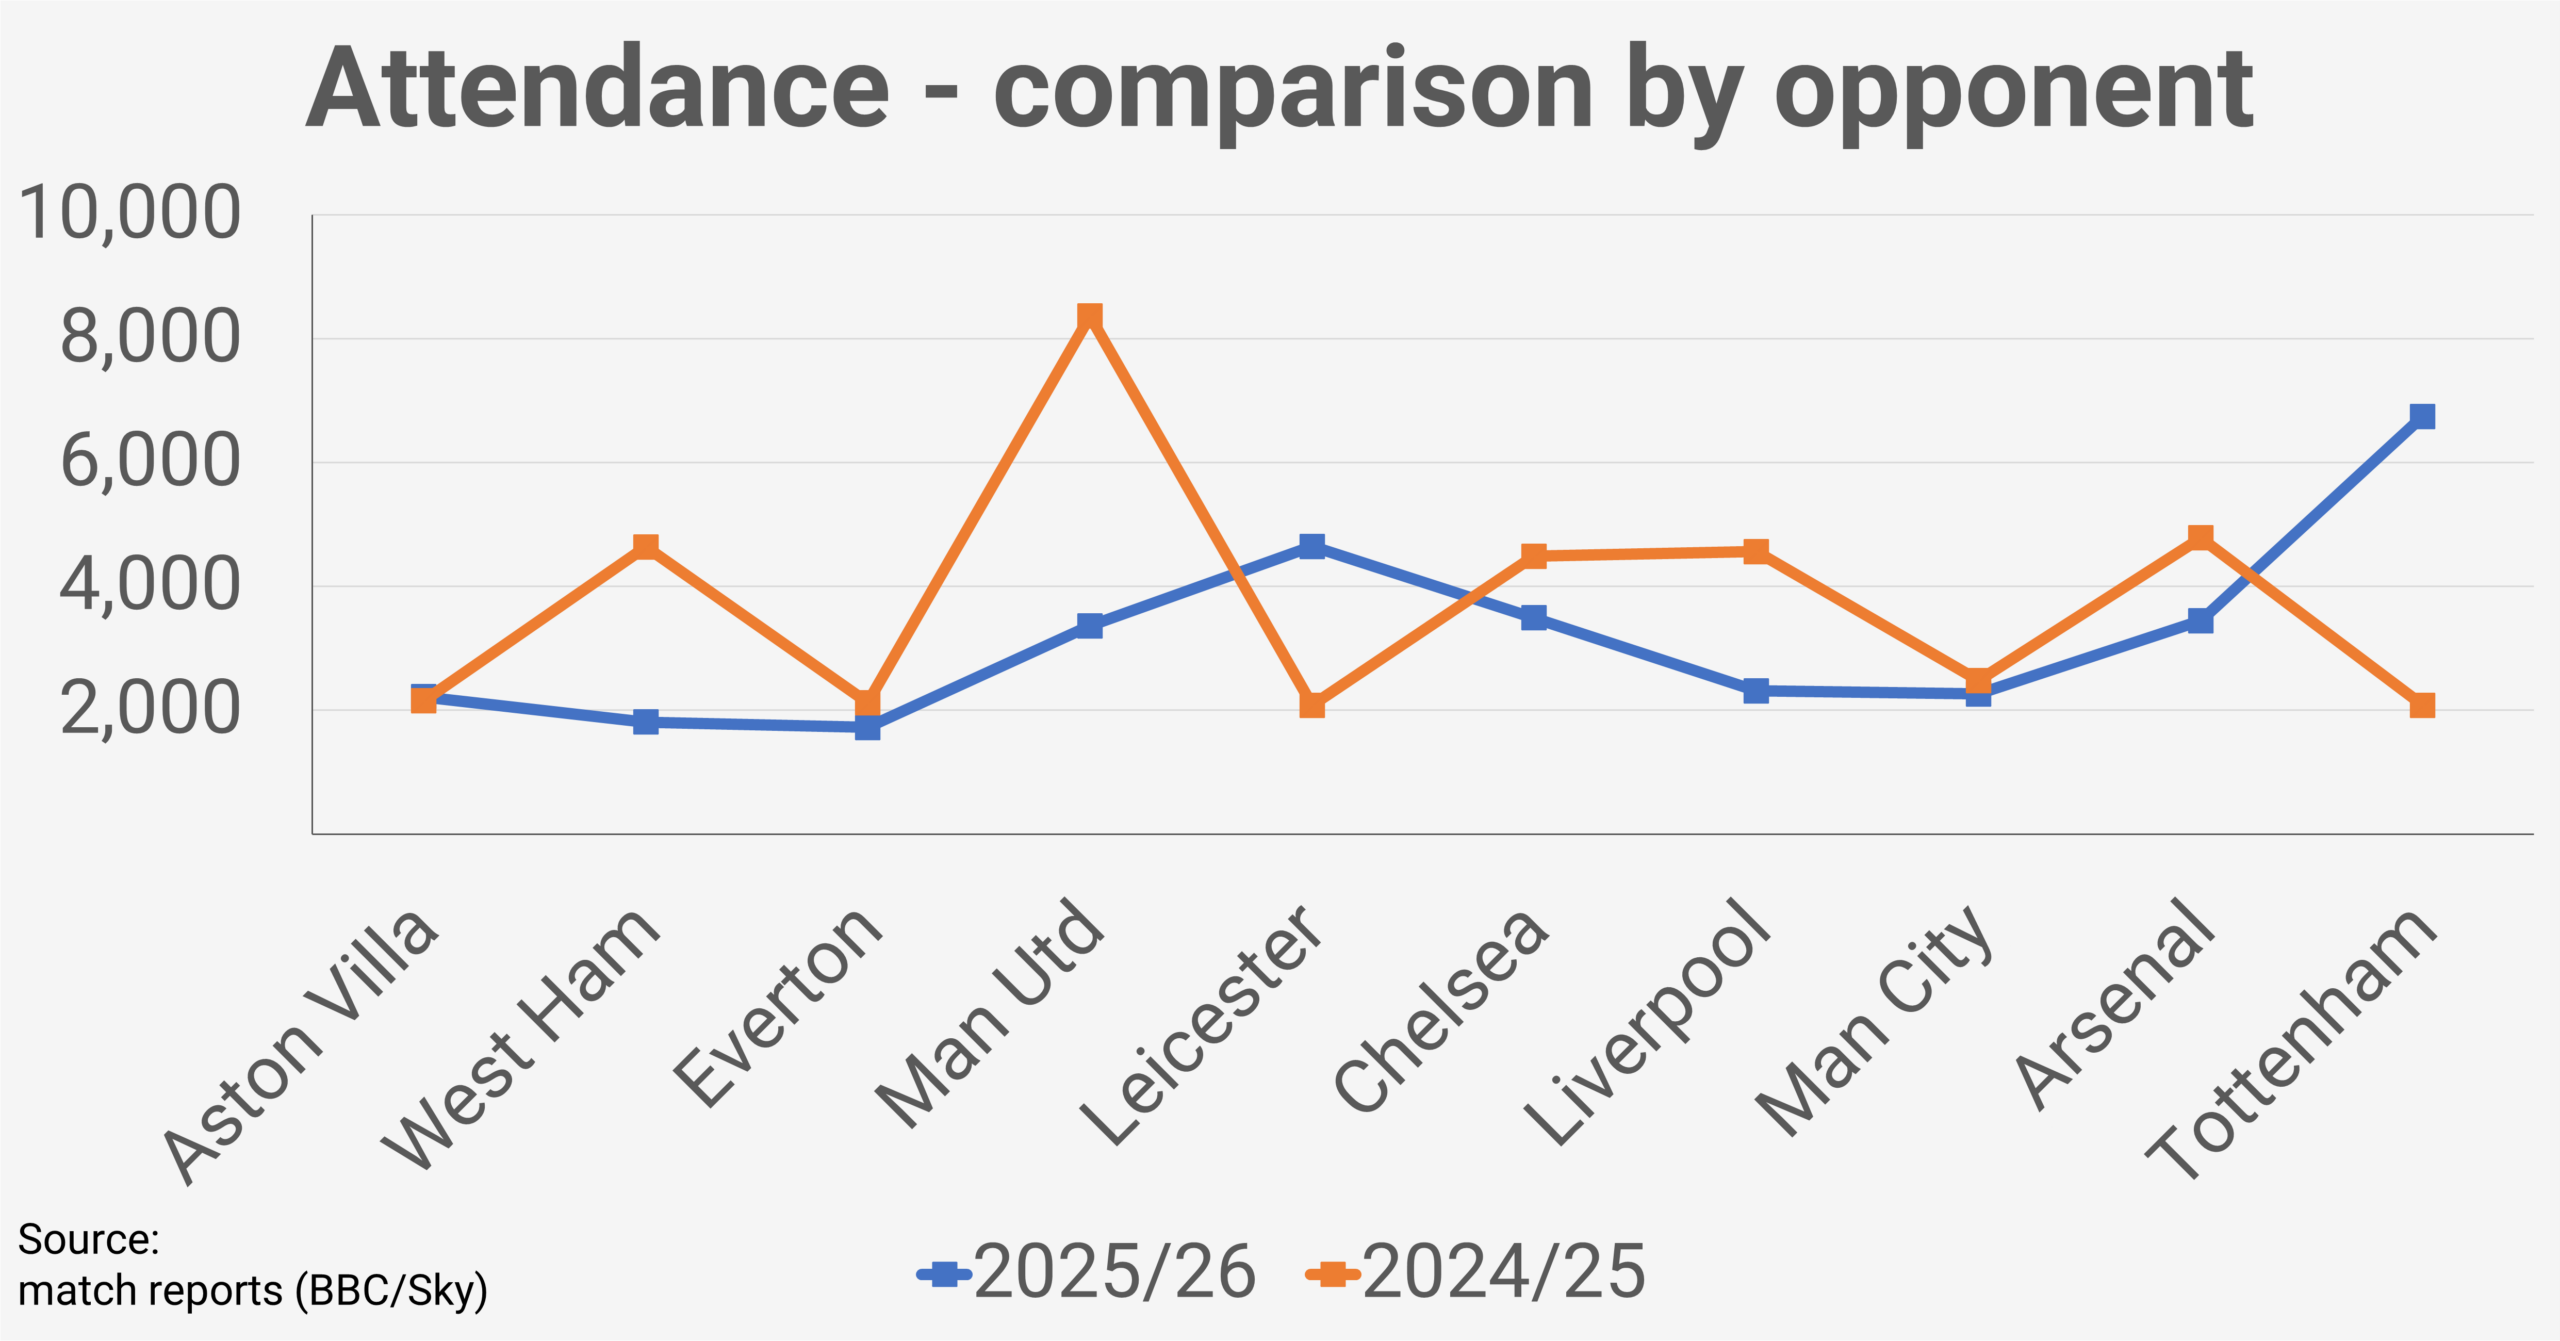
Brighton attendance analysis – 2025/26

Stadium Games Total Average Change*
Broadfield Stadium9/1122,6252,514-14%
Amex Stadium2/1111,3945,69716%
Total11/1134,0193,093-15%
Change* – 2025/26 average attendance compared to 2024/25.

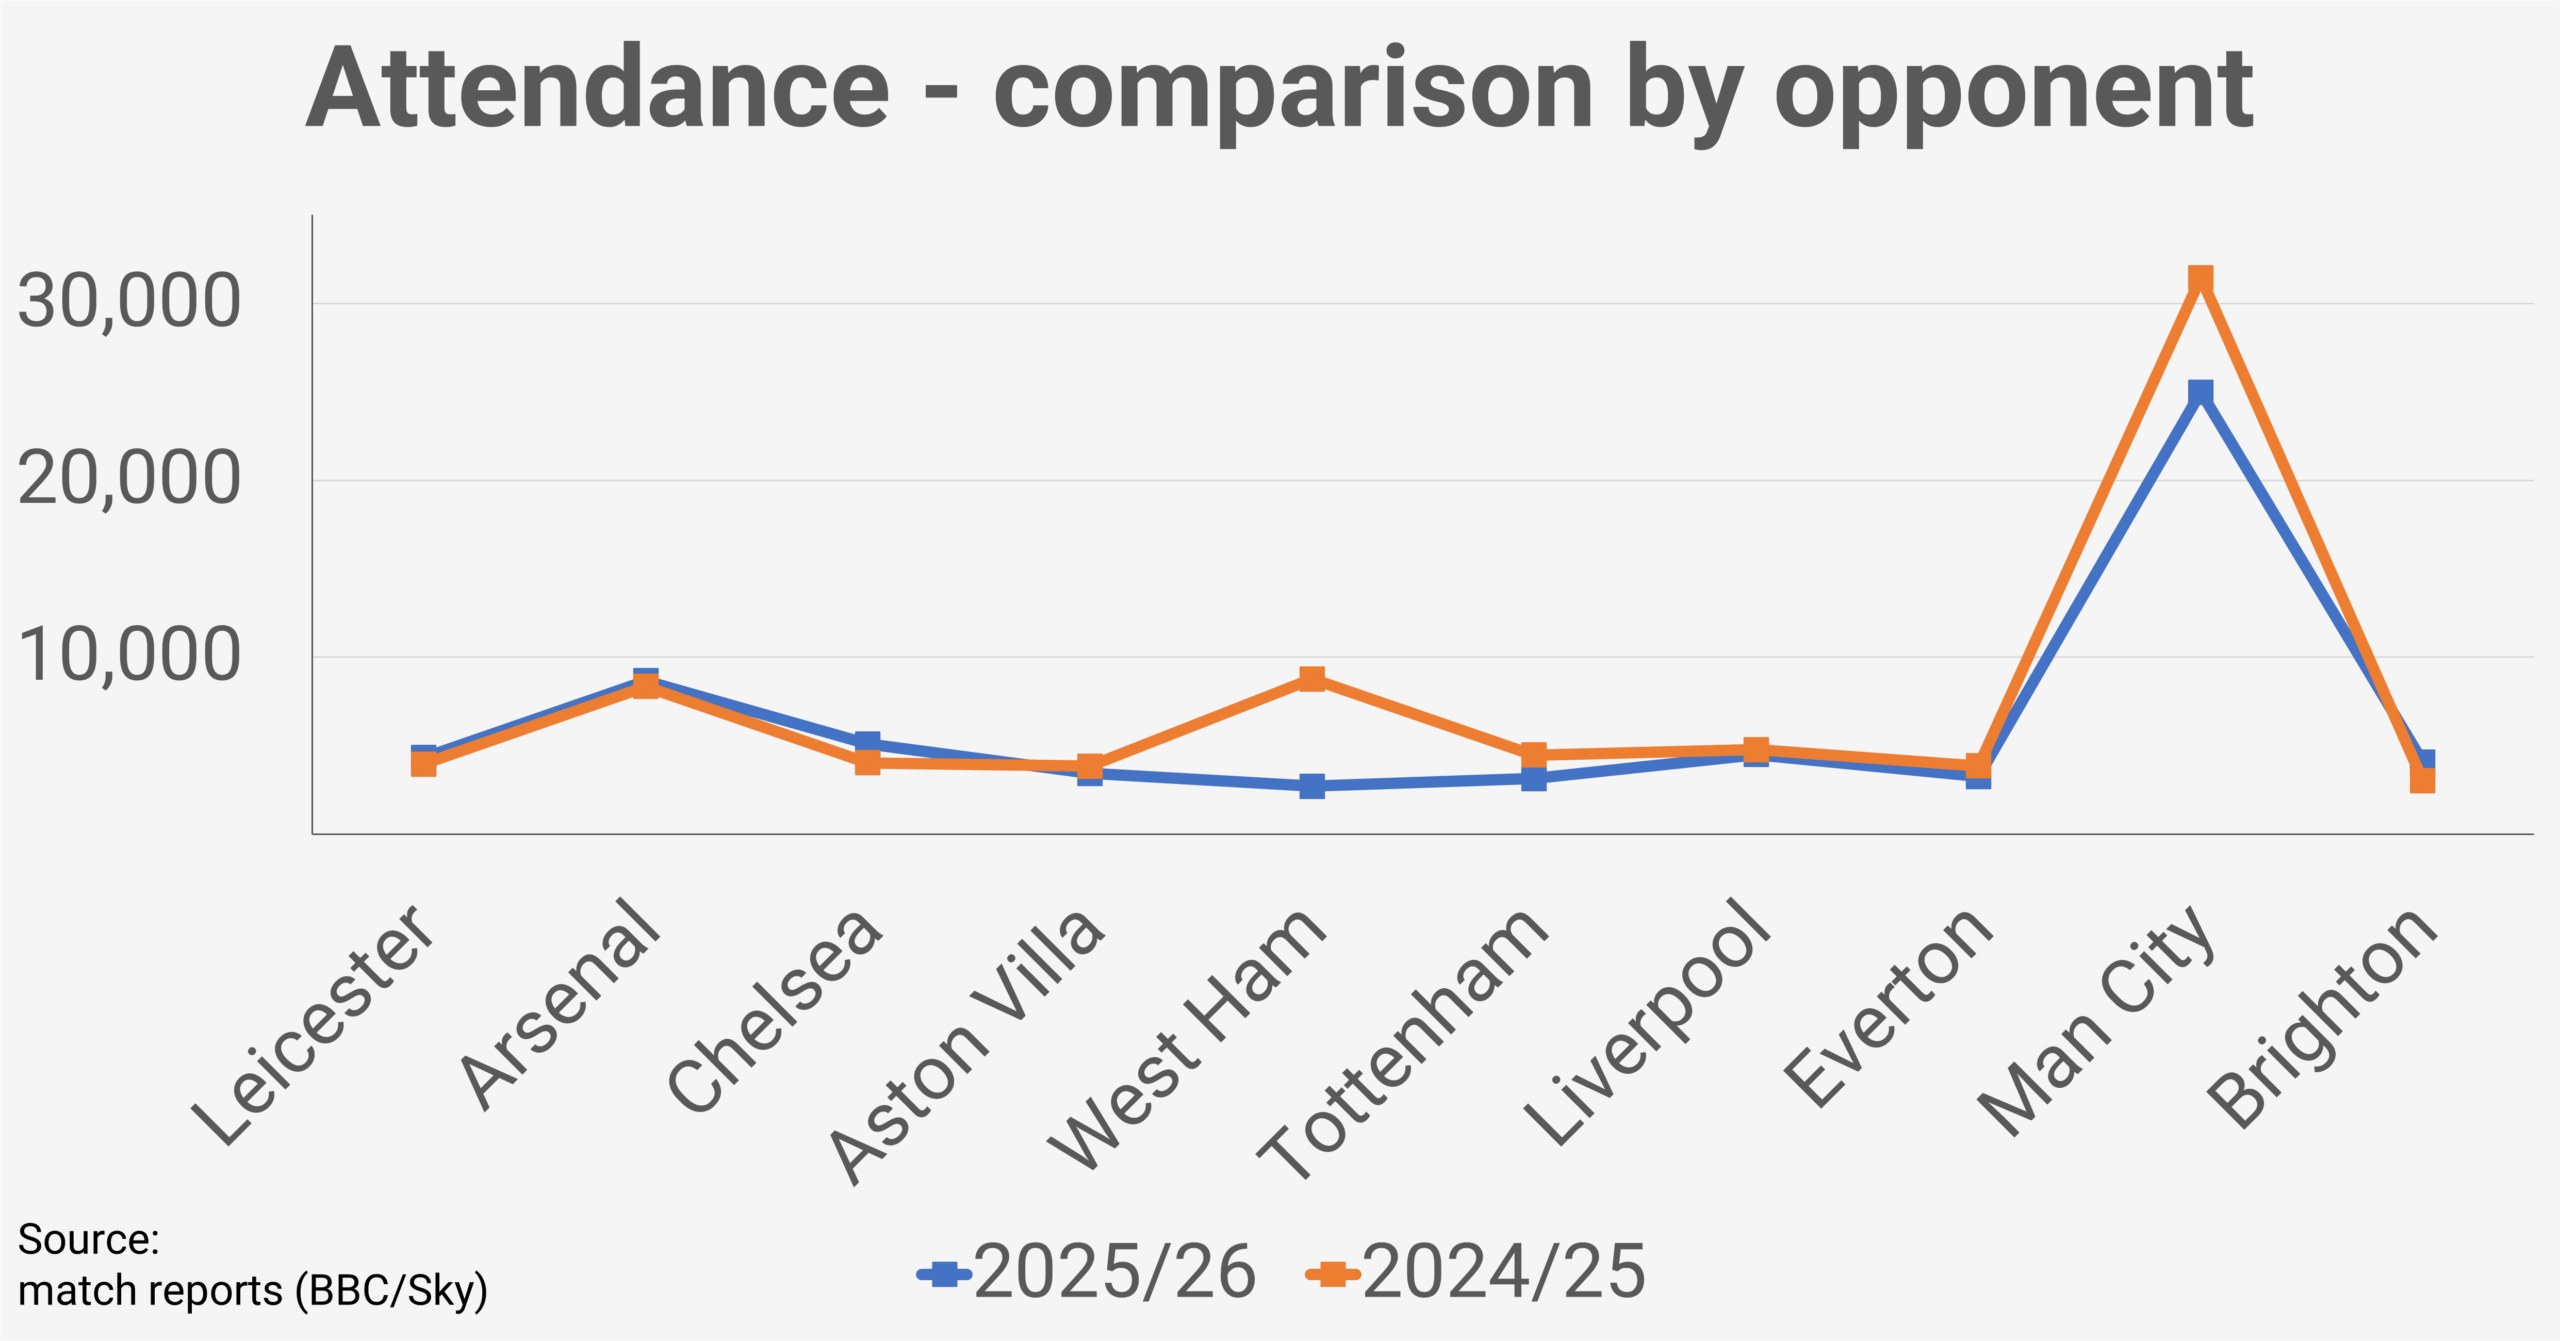
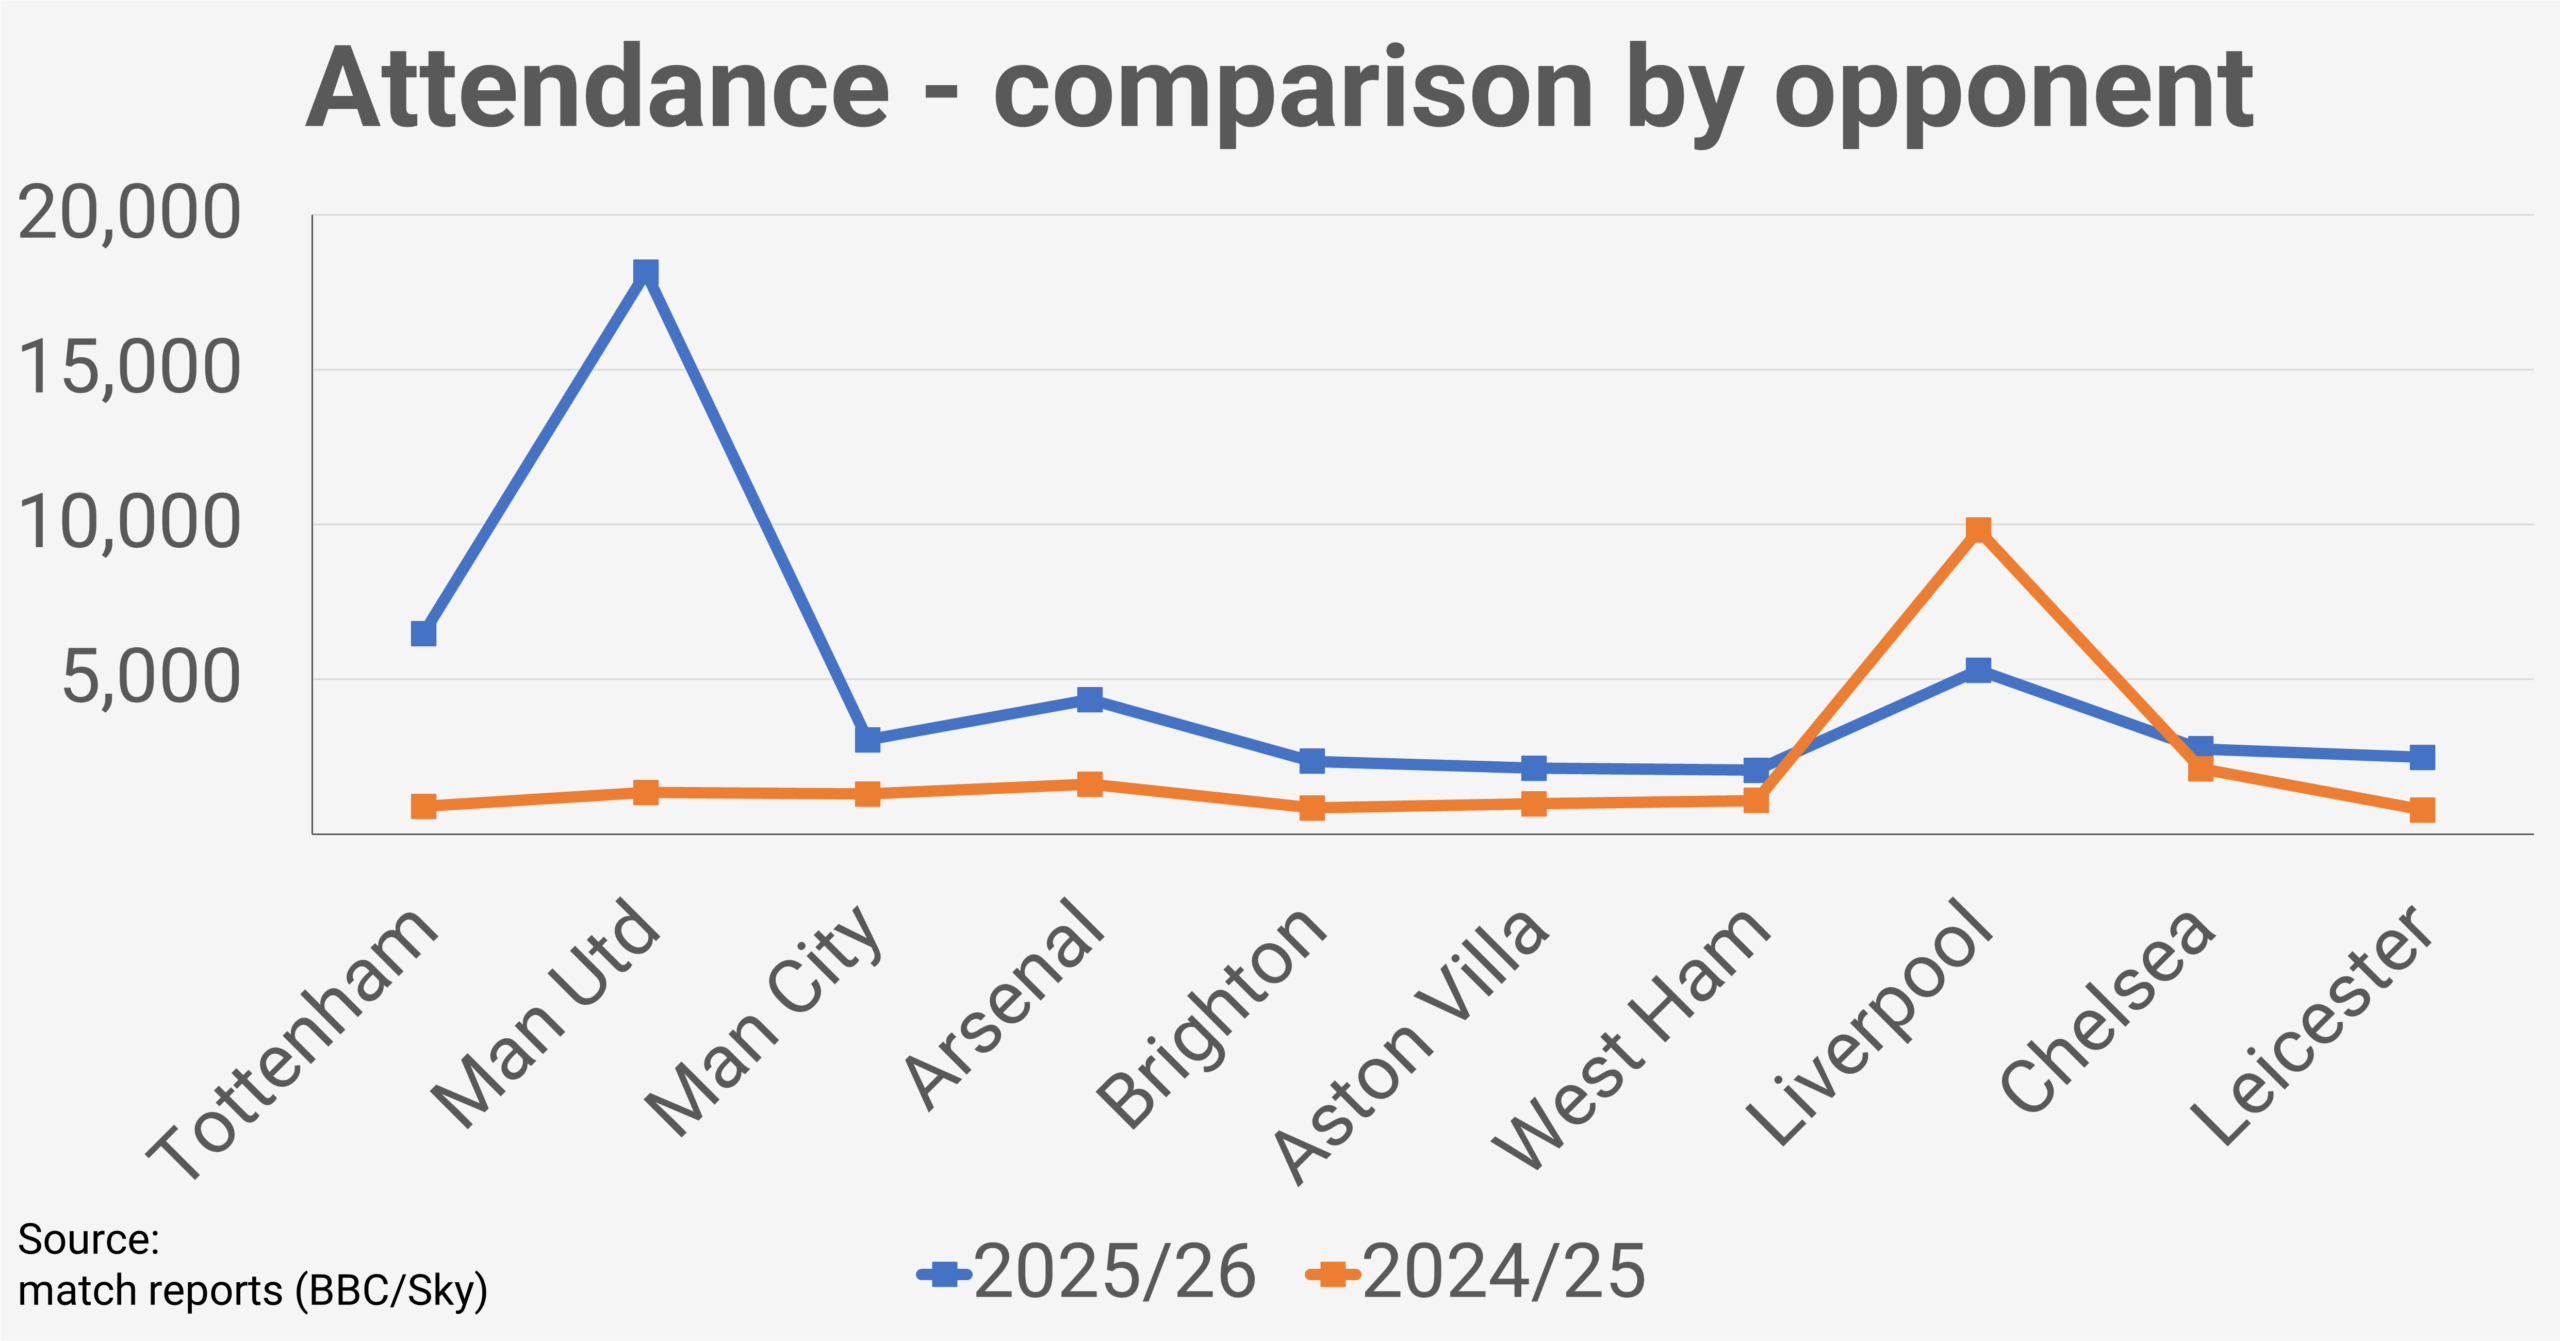
Brighton halved the number of games they staged at the Amex in 2025/26 compared with 2024/25, a shift that fed into an overall 15% drop in their average attendance across the season.

The reduced Amex schedule did however, translate into bigger individual crowds when they did use the main stadium: 4,645 watched their first game against Leicester—a 123% increase on the same fixture at the same ground in 2024/25—and the final‑day meeting with Tottenham drew 6,749, the third‑highest WSL attendance in the club’s history.

By contrast, four of the five repeat opponents at Broadfield Stadium in 2025/26 attracted fewer spectators than the previous season, contributing to a 15% year‑on‑year decline at that venue.

NOTE: The chart above displays attendances for the 2025/26 season in chronological order with comparisons to corresponding games in the 2024/25 season. Newly promoted London City Lionesses and Crystal Palace who were relegated from the WSL at the end of the 2024/25 season are omitted from the chart but are included in the attendance data.