| Stadium | Games | Total | Average | Change* |
|---|---|---|---|---|
| Joie Stadium | 9/11 | 30,308 | 3,368 | -3% |
| Etihad Stadium | 2/11 | 30,748 | 15,374 | 5% |
| Total | 11/11 | 61,056 | 5,551 | -15% |
| Change* – 2025/26 average attendance compared to 2024/25. | ||||
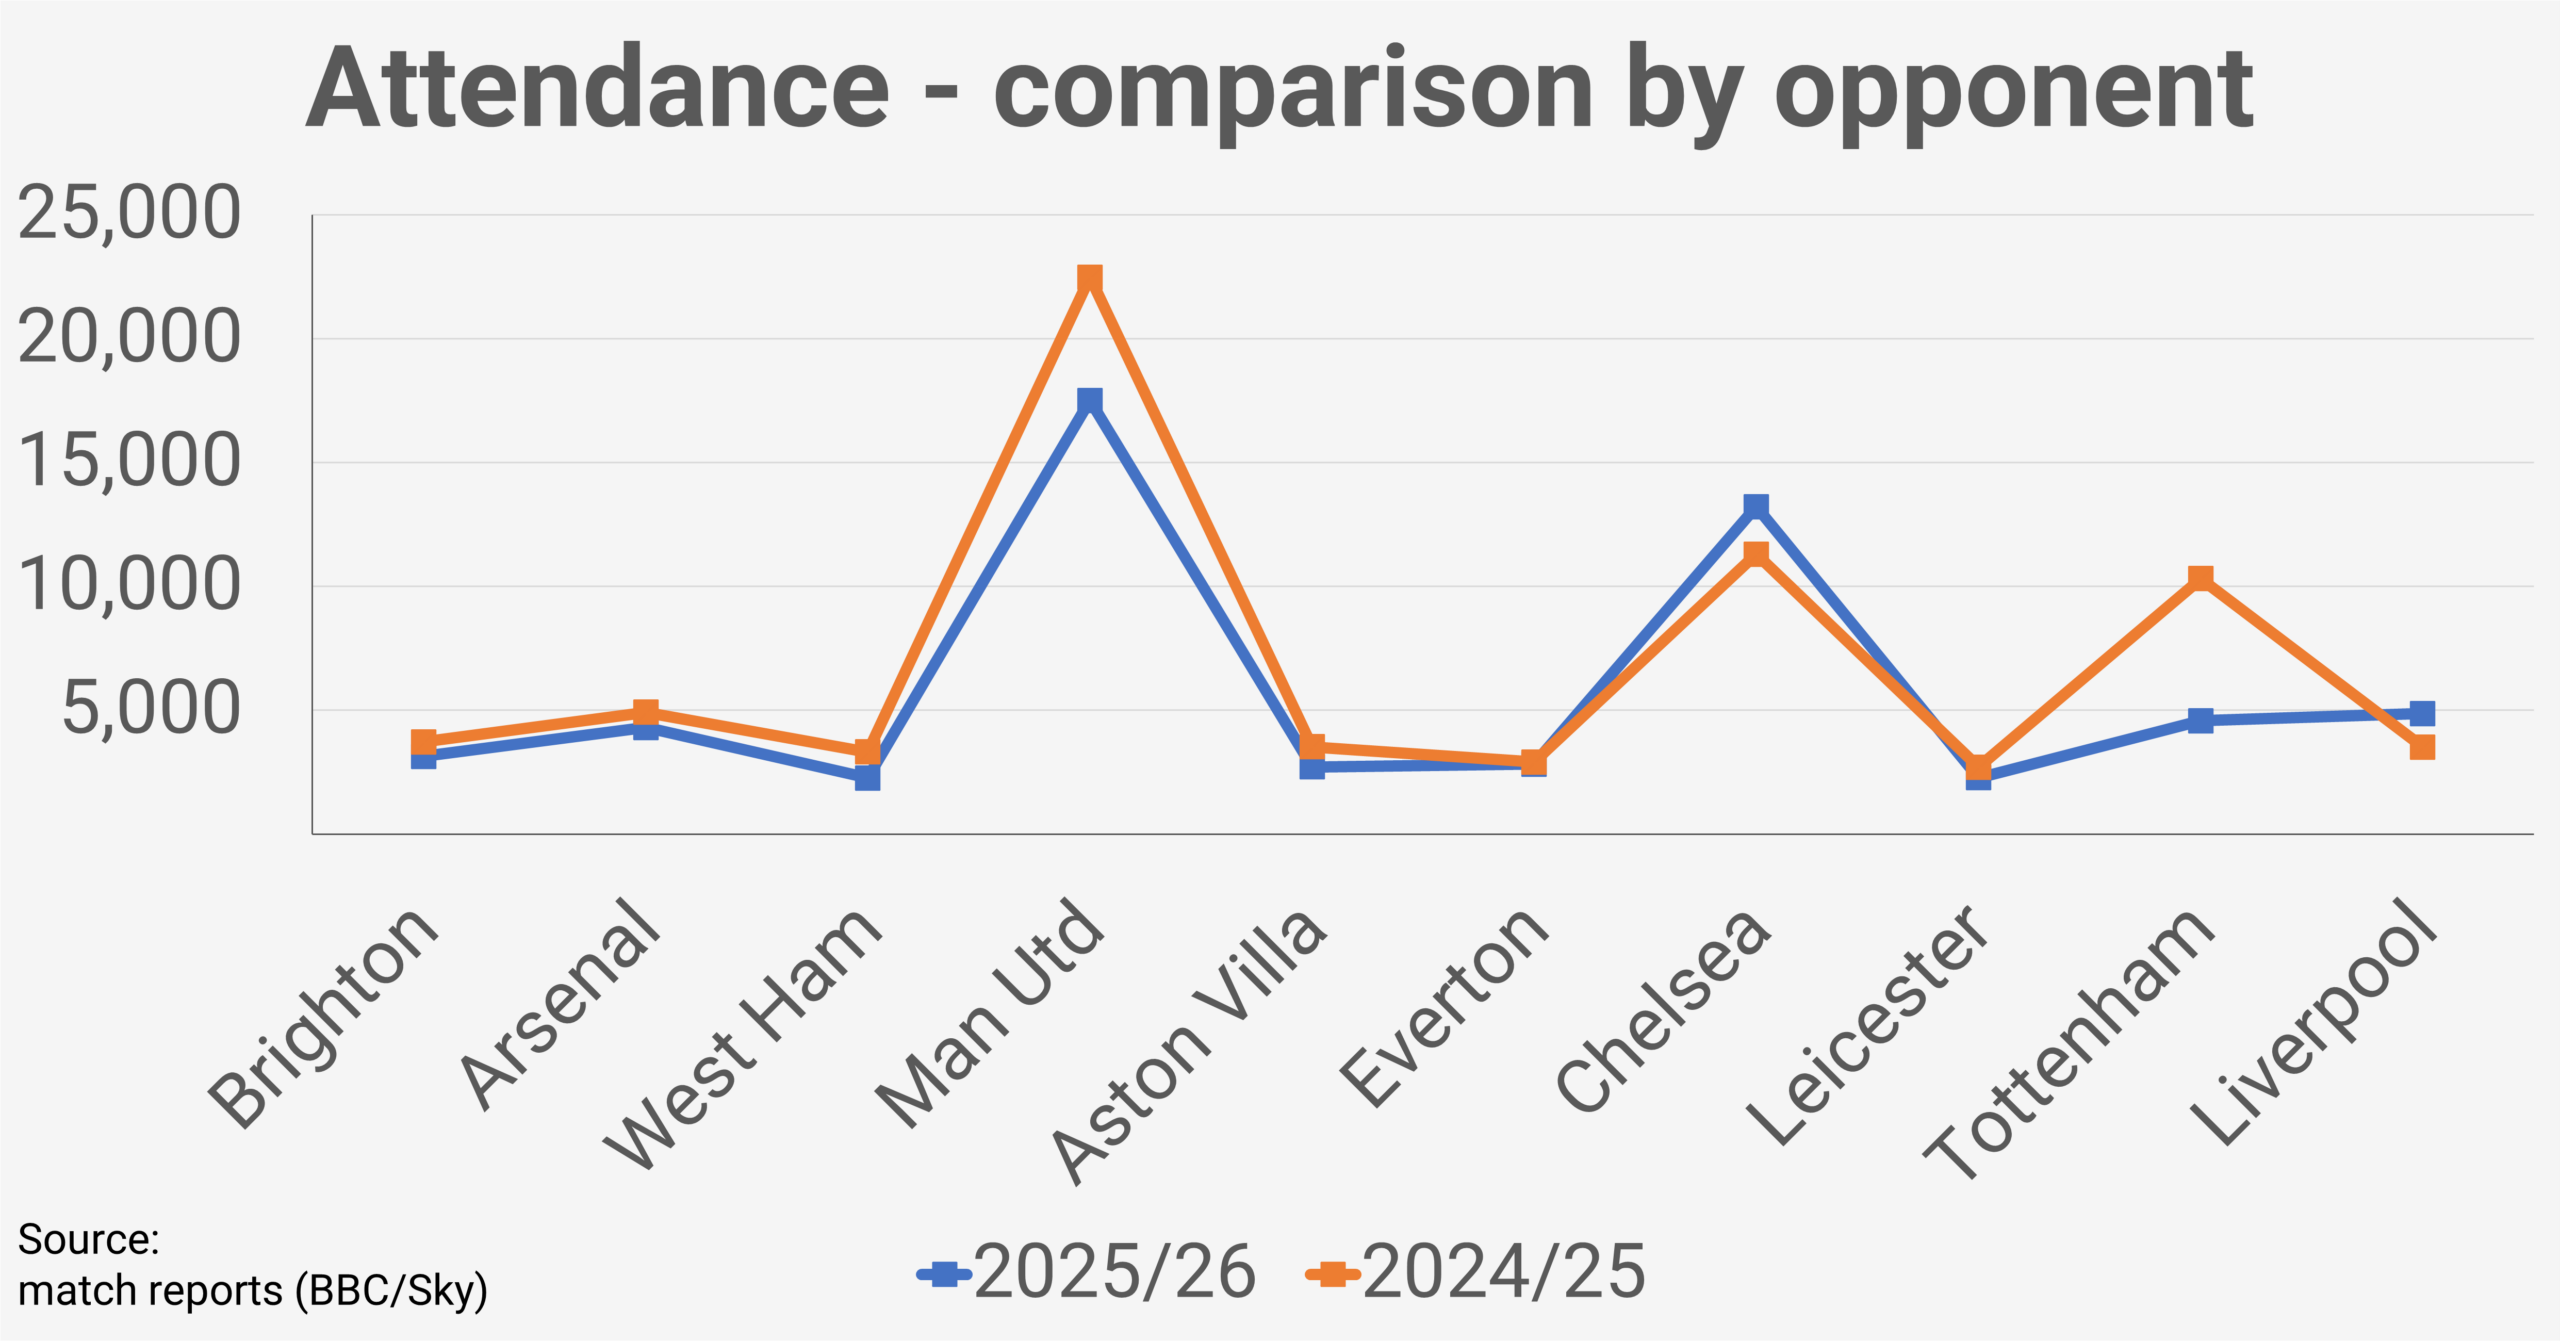
Manchester City played one game fewer at the Etihad Stadium than in 2024/25, which was the key factor behind the 15% overall drop in average attendances.
While the derby against Manchester United saw a fall of 22%, their meeting with Chelsea saw a 17% rise compared to last season and the club’s focus on playing just these two high-profile games resulted in a 5% rise in average attendance at the club’s main stadium in 2025/26.
Despite their success on the field, attendances at the Joie Stadium didn’t follow suit and up until March, average crowds were 15% down year-on-year.
However, as they closed in on the title, games against Tottenham and Liverpool both attracted over 4,500 fans and average attendances at the venue finished just 3% down on the previous season.
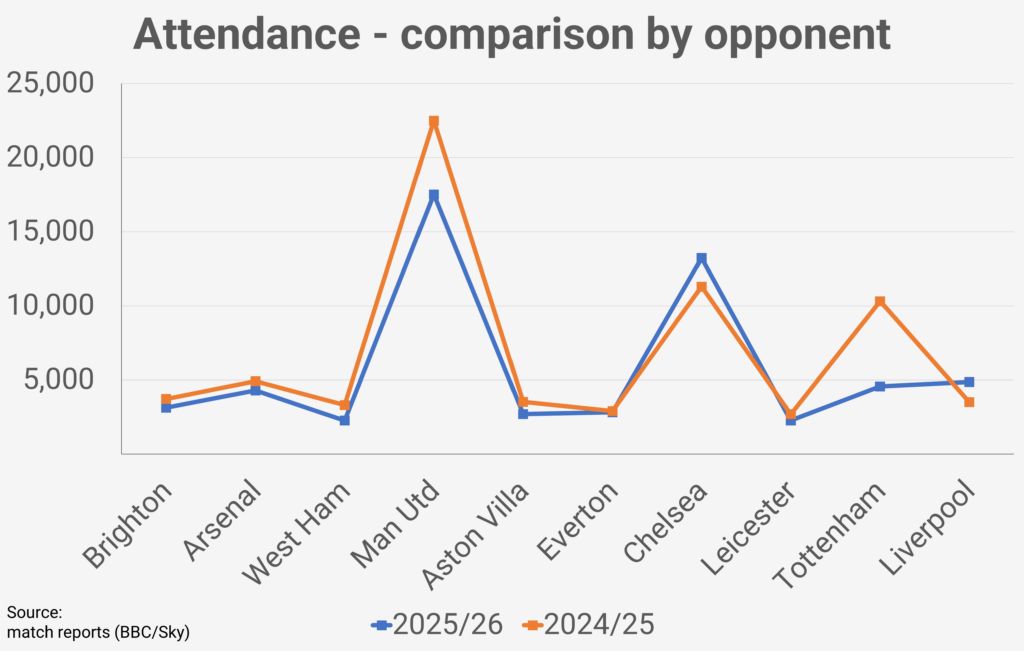
NOTE: The chart above displays attendances for the 2025/26 season in chronological order with comparisons to corresponding games in the 2024/25 season. Newly promoted London City Lionesses and Crystal Palace who were relegated from the WSL at the end of the 2024/25 season are omitted from the chart but are included in the attendance data.