| Stadium | Games | Total | Average | Change* |
|---|---|---|---|---|
| Chigwell Construction Stadium | 11/11 | 18,725 | 1,702 | -7% |
| London Stadium | 0/11 | n/a | 0 | 0% |
| Total | 11/11 | 18,725 | 1,702 | -7% |
| Change* – 2025/26 average attendance compared to 2024/25. | ||||
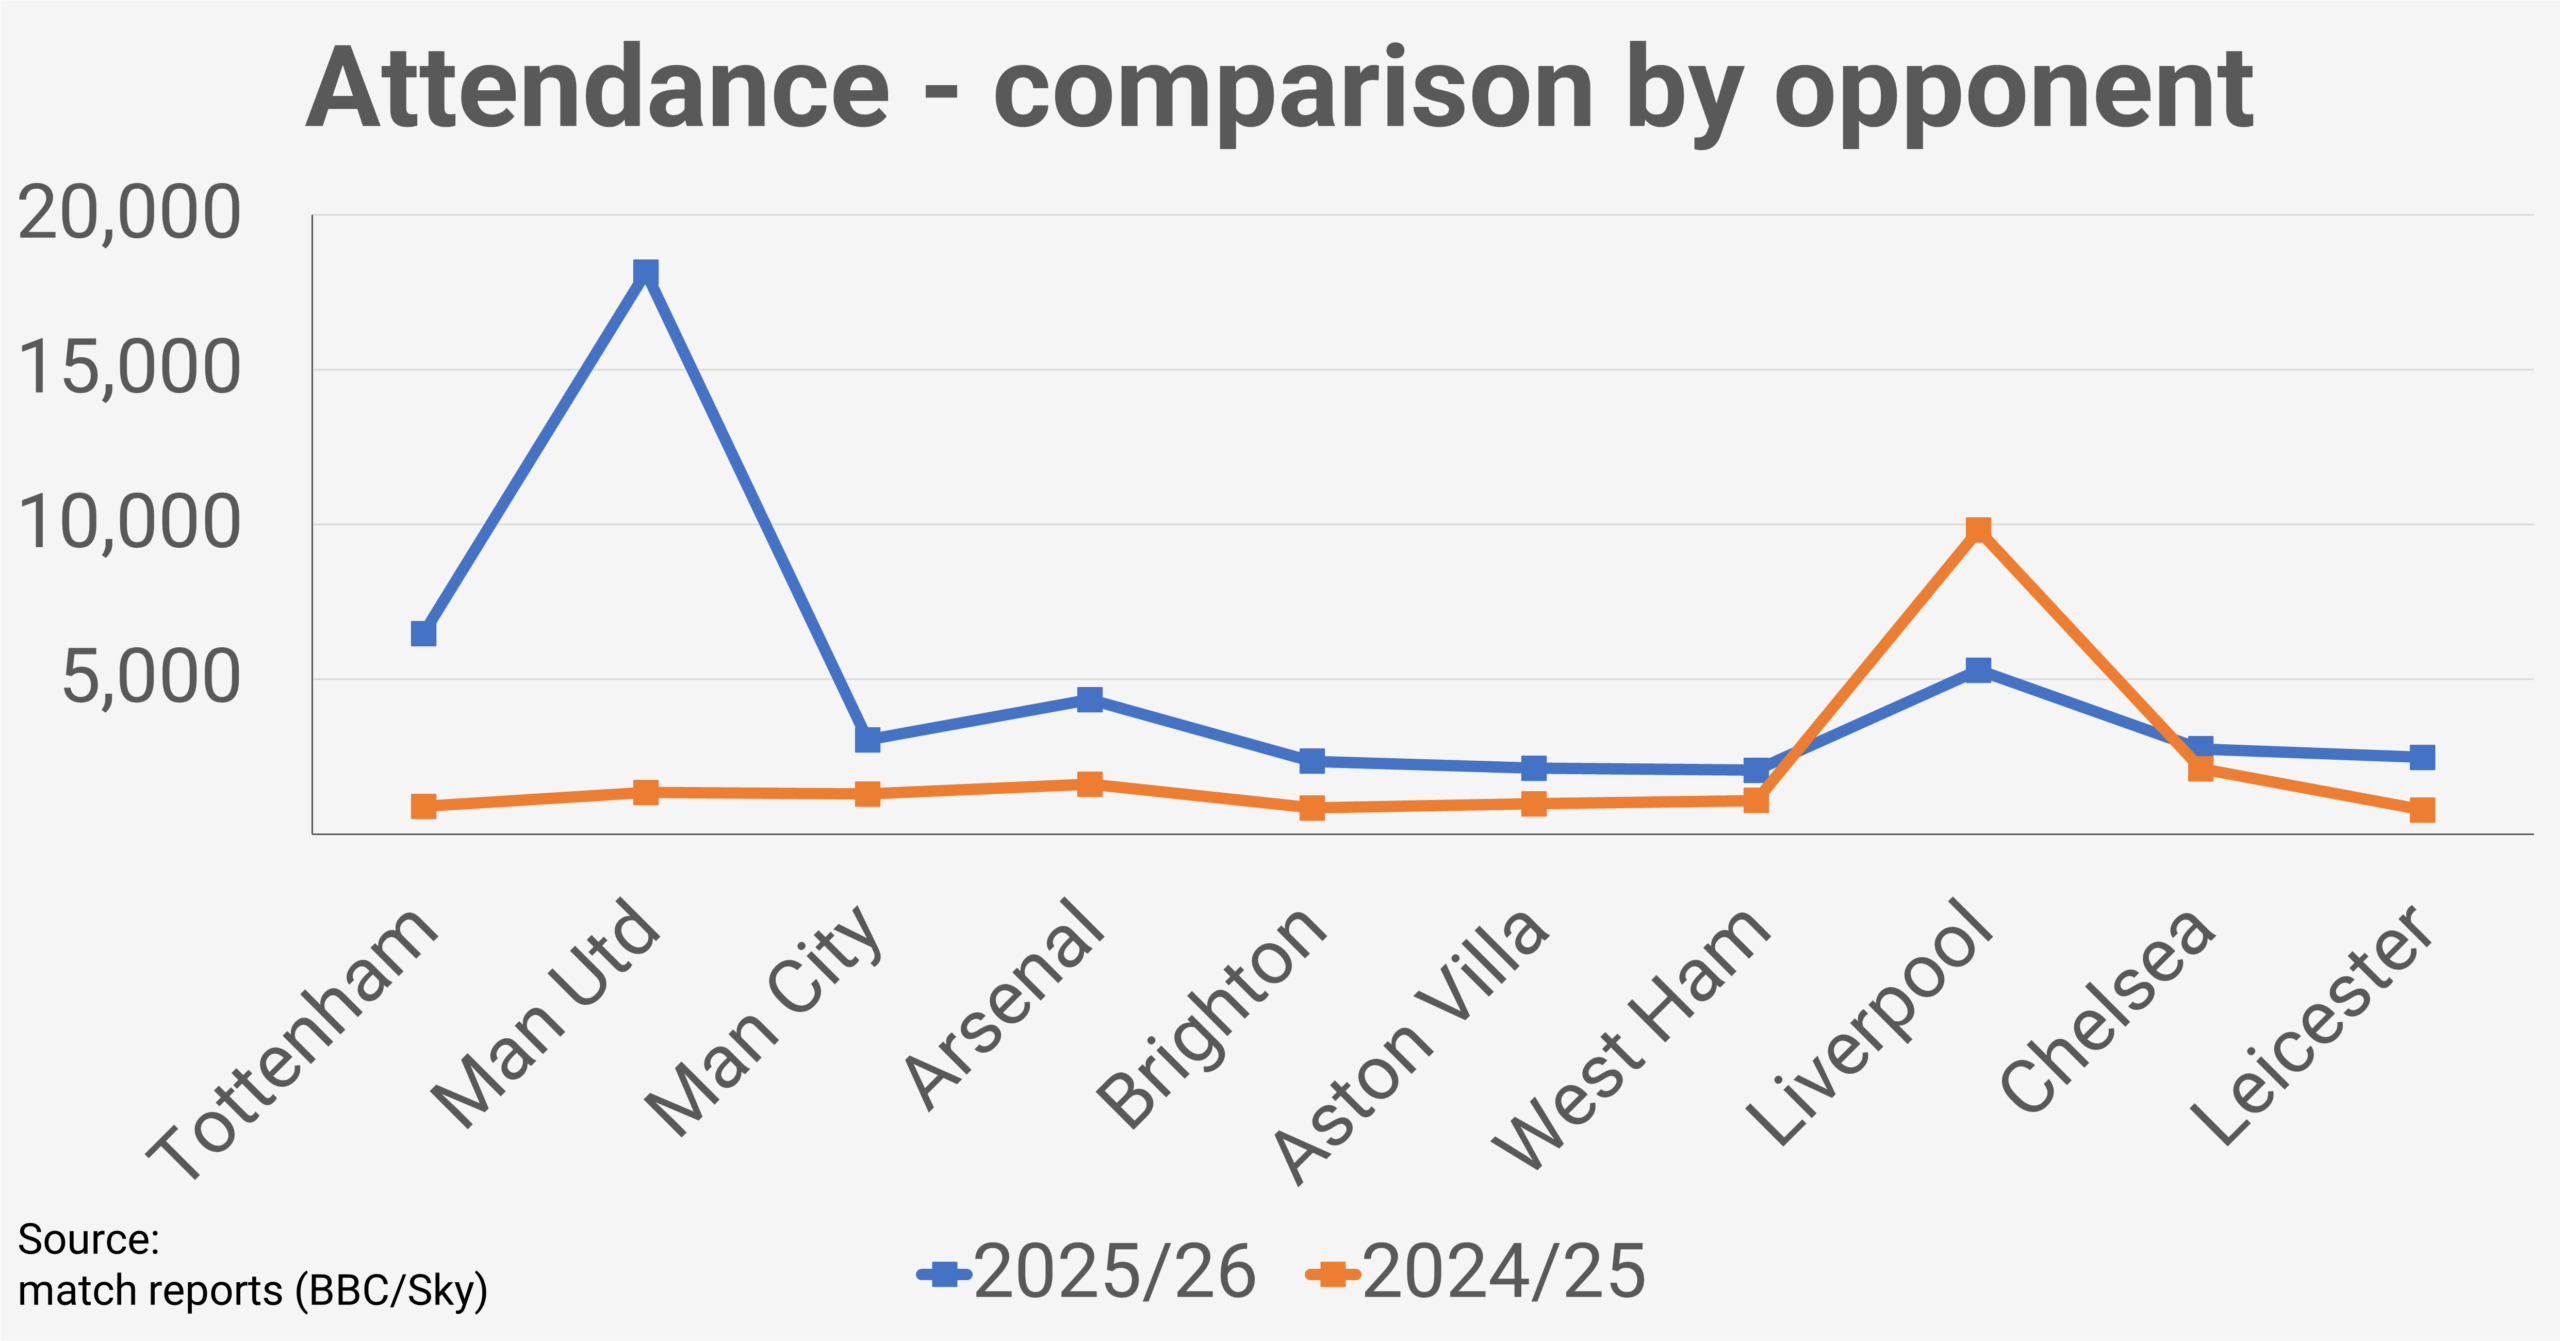
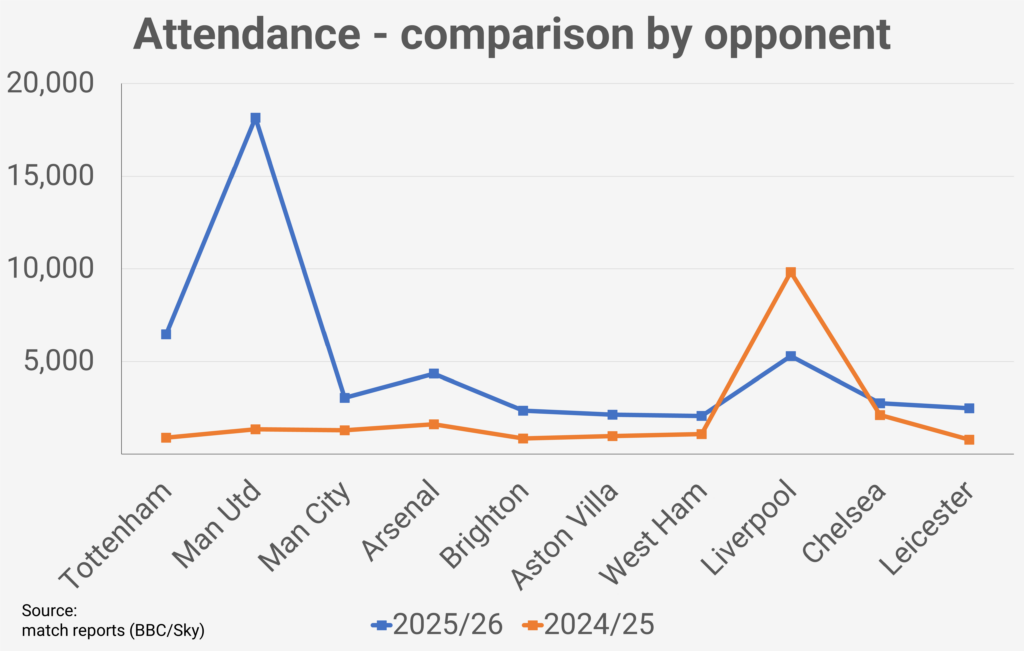
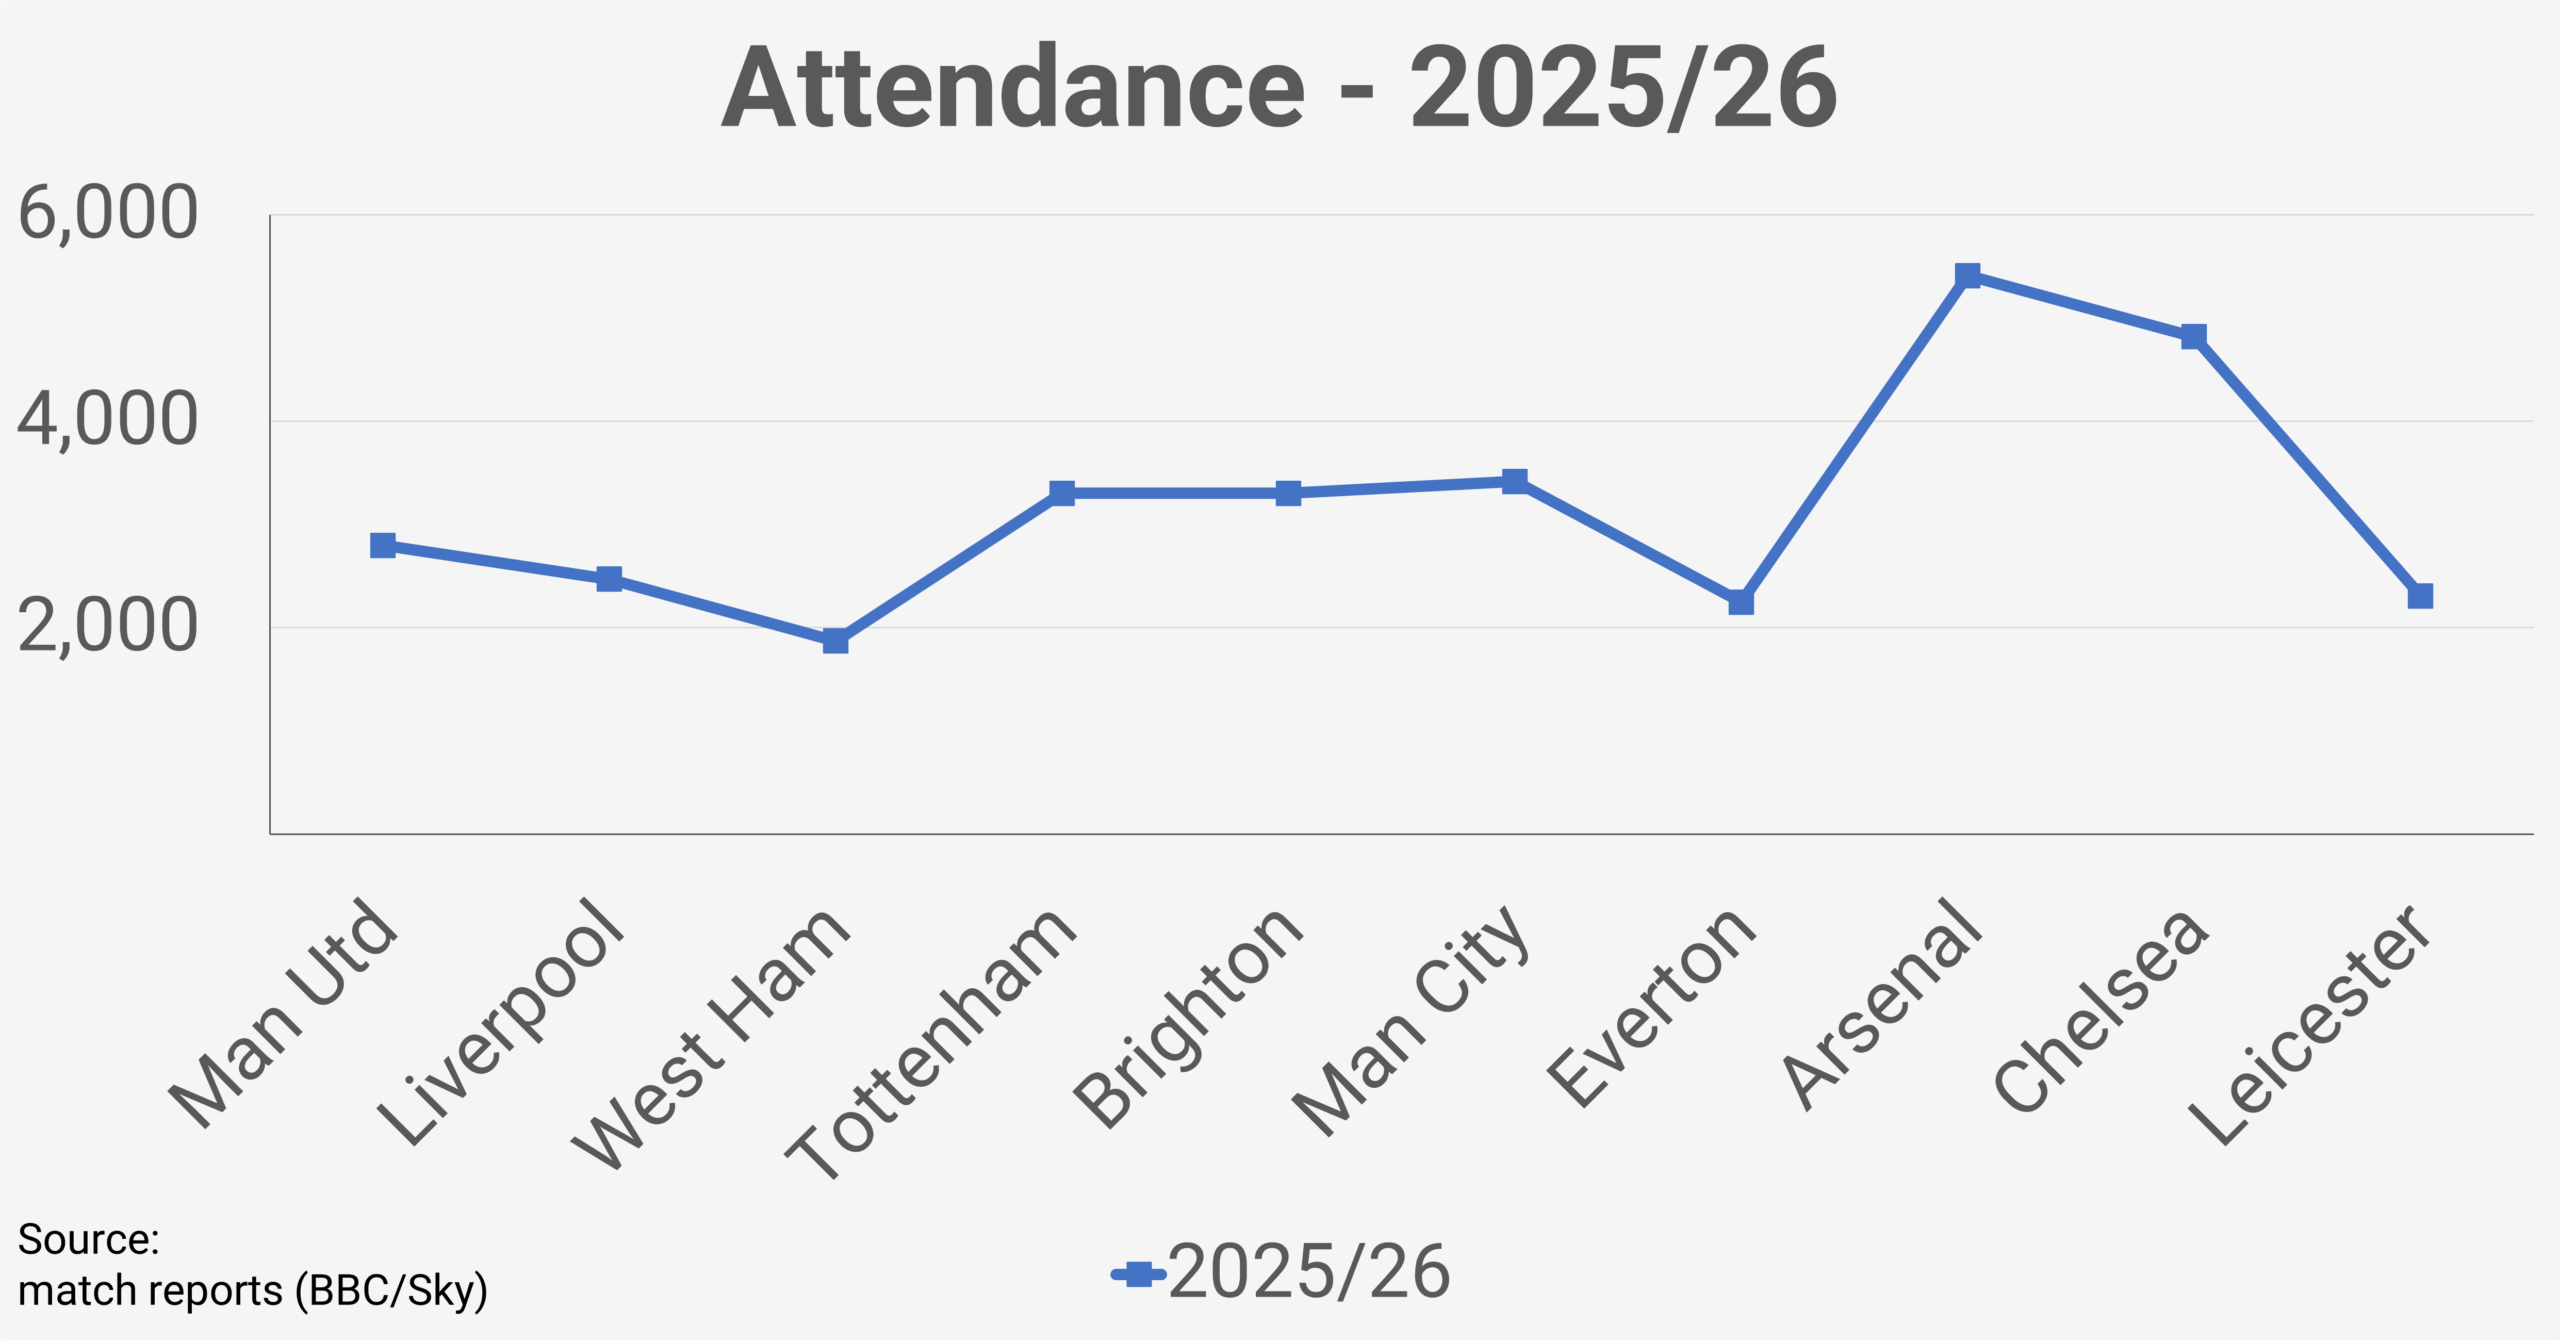
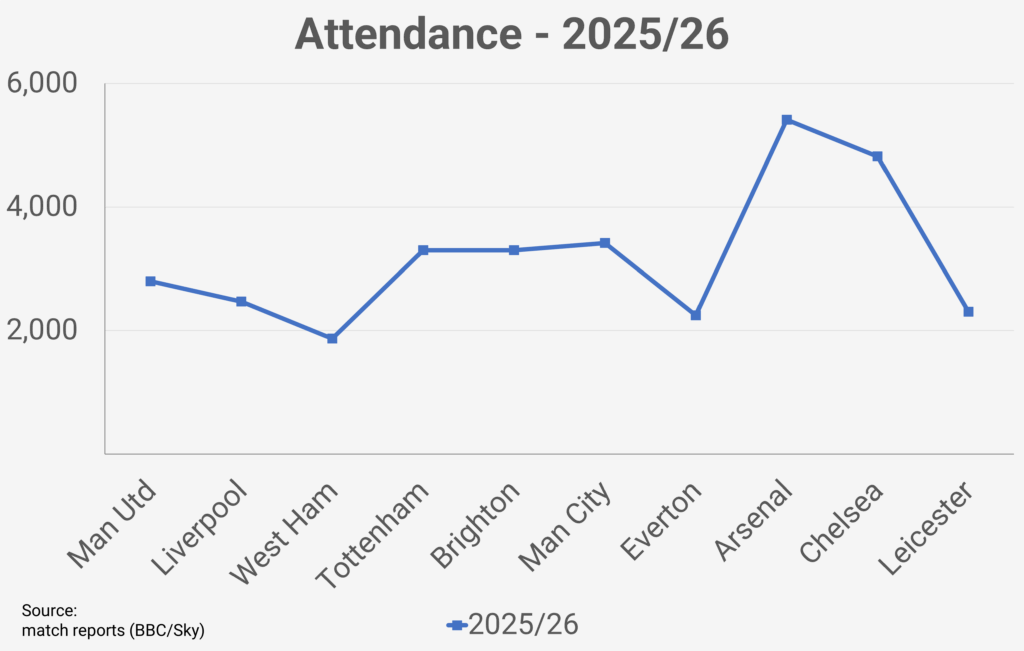
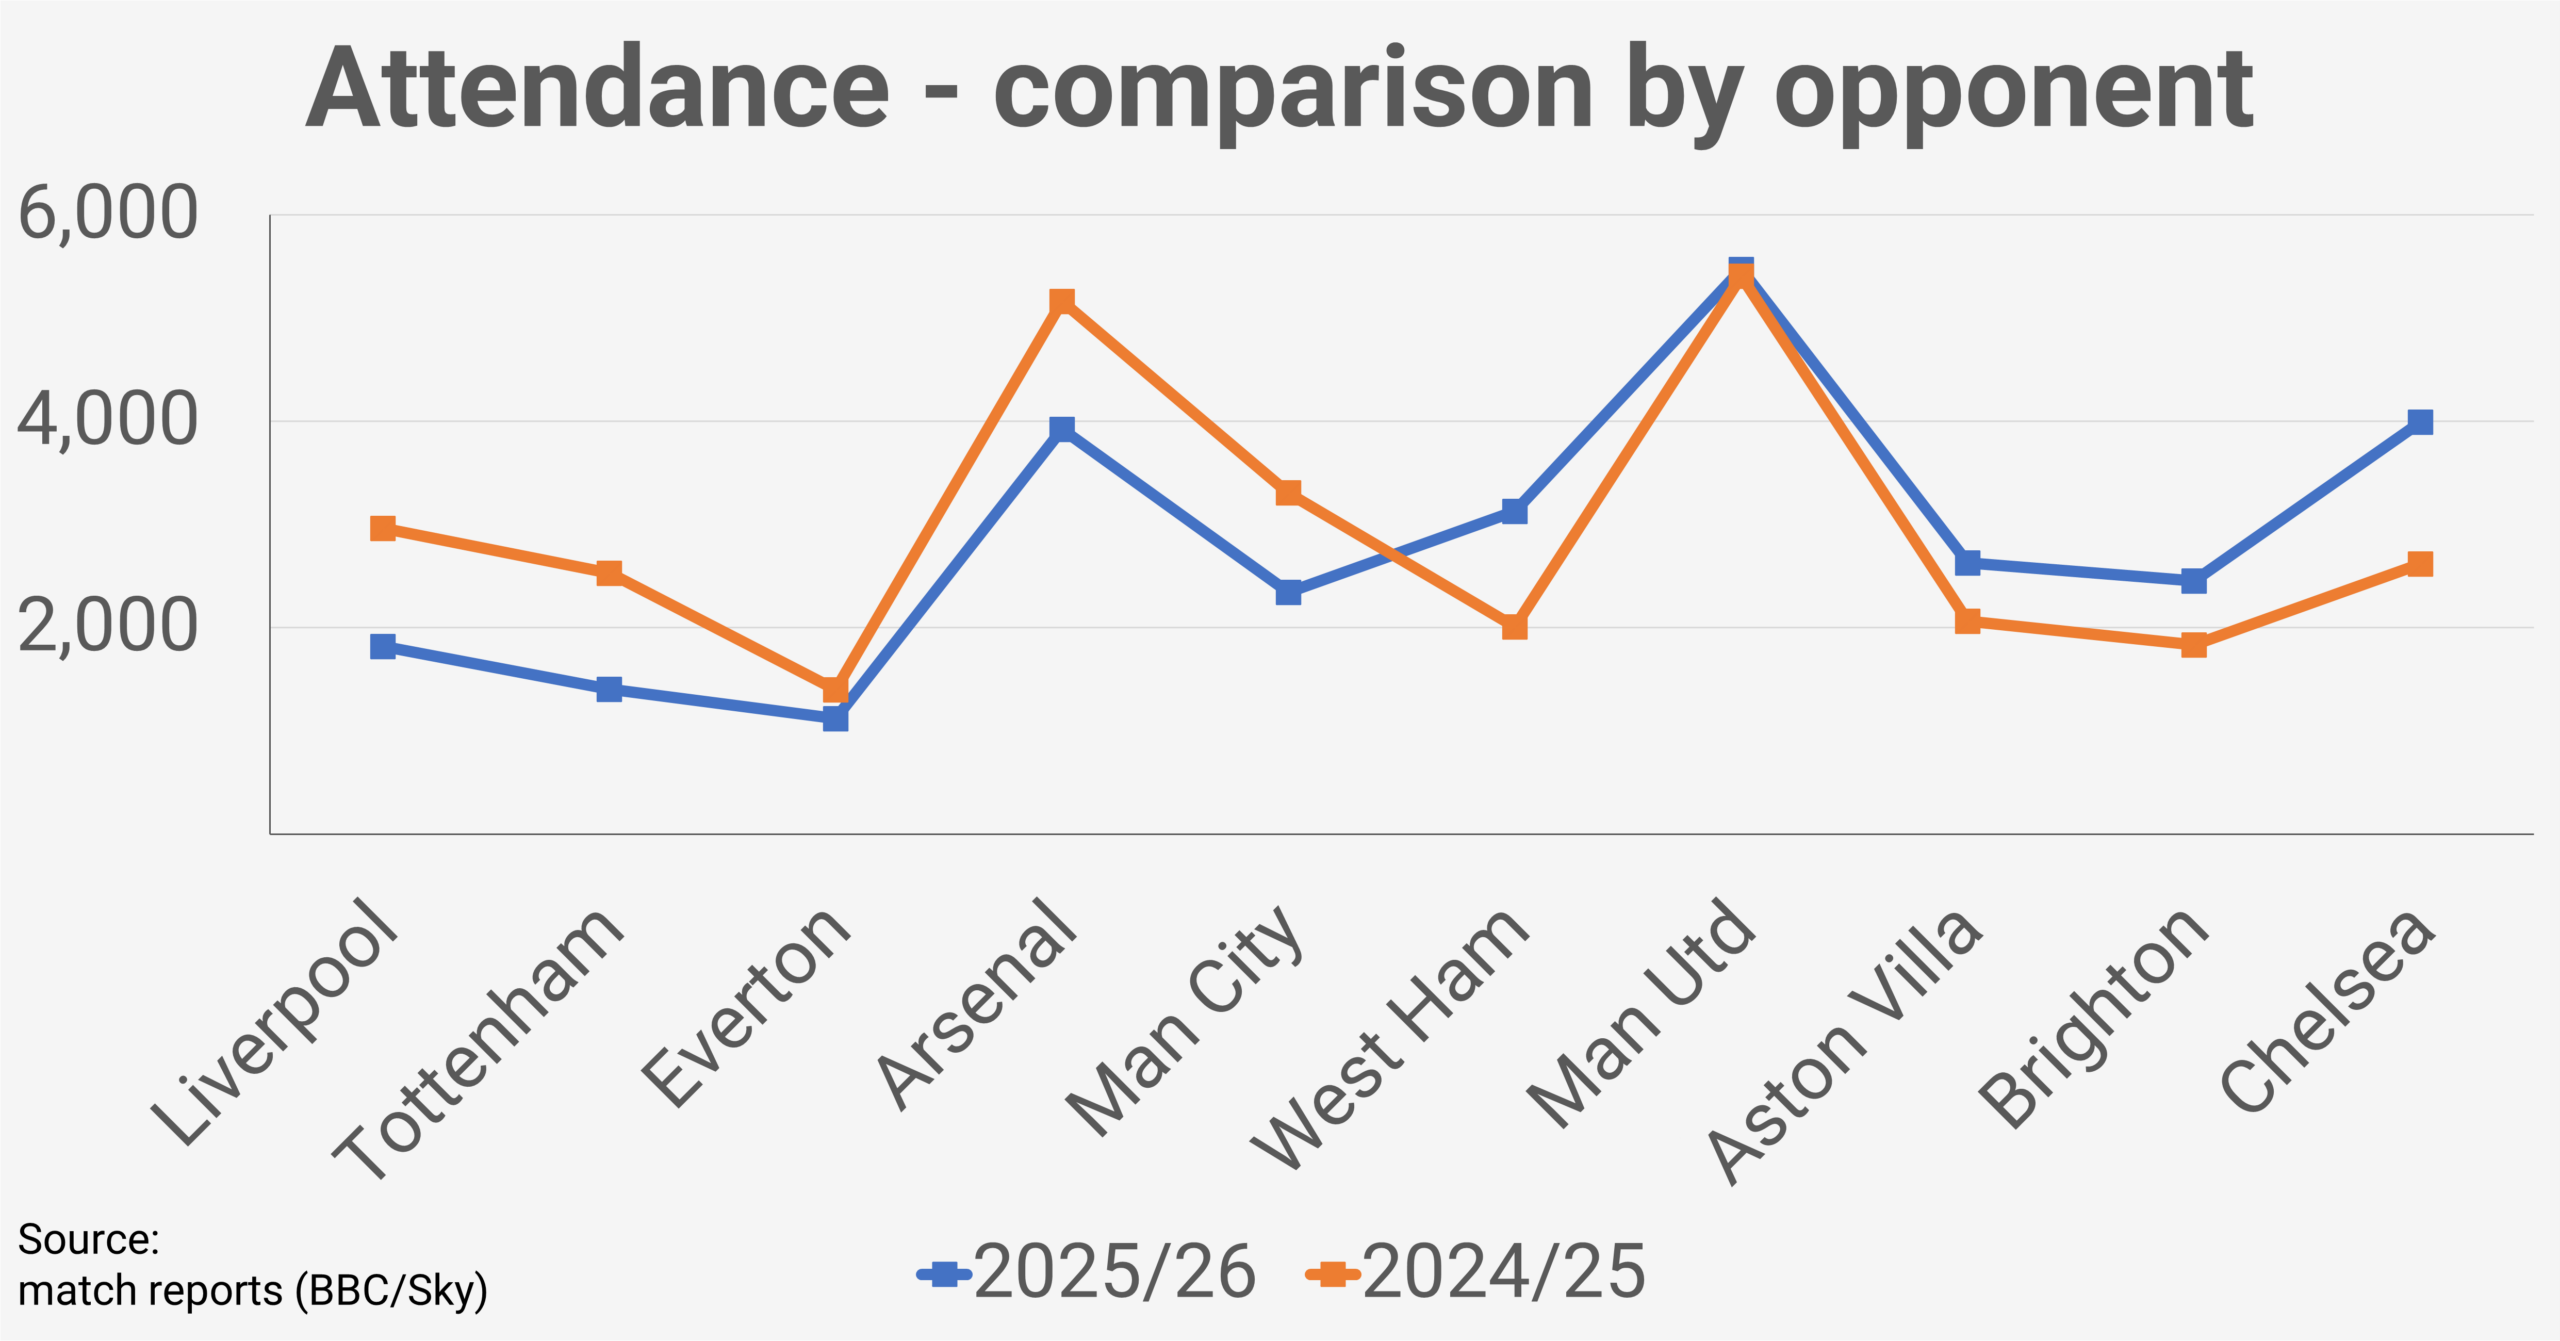
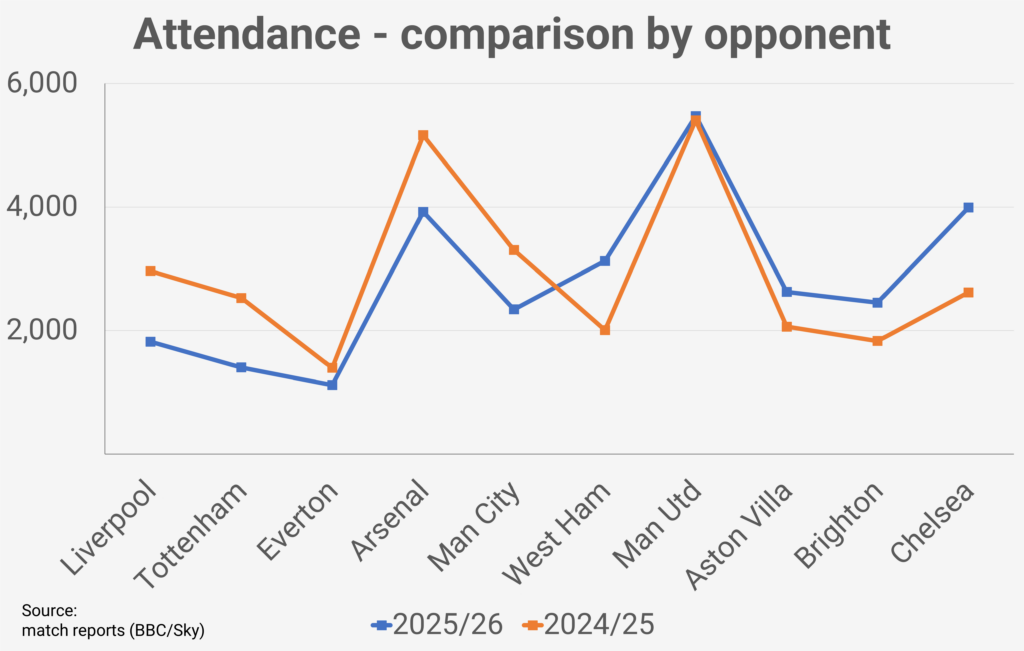
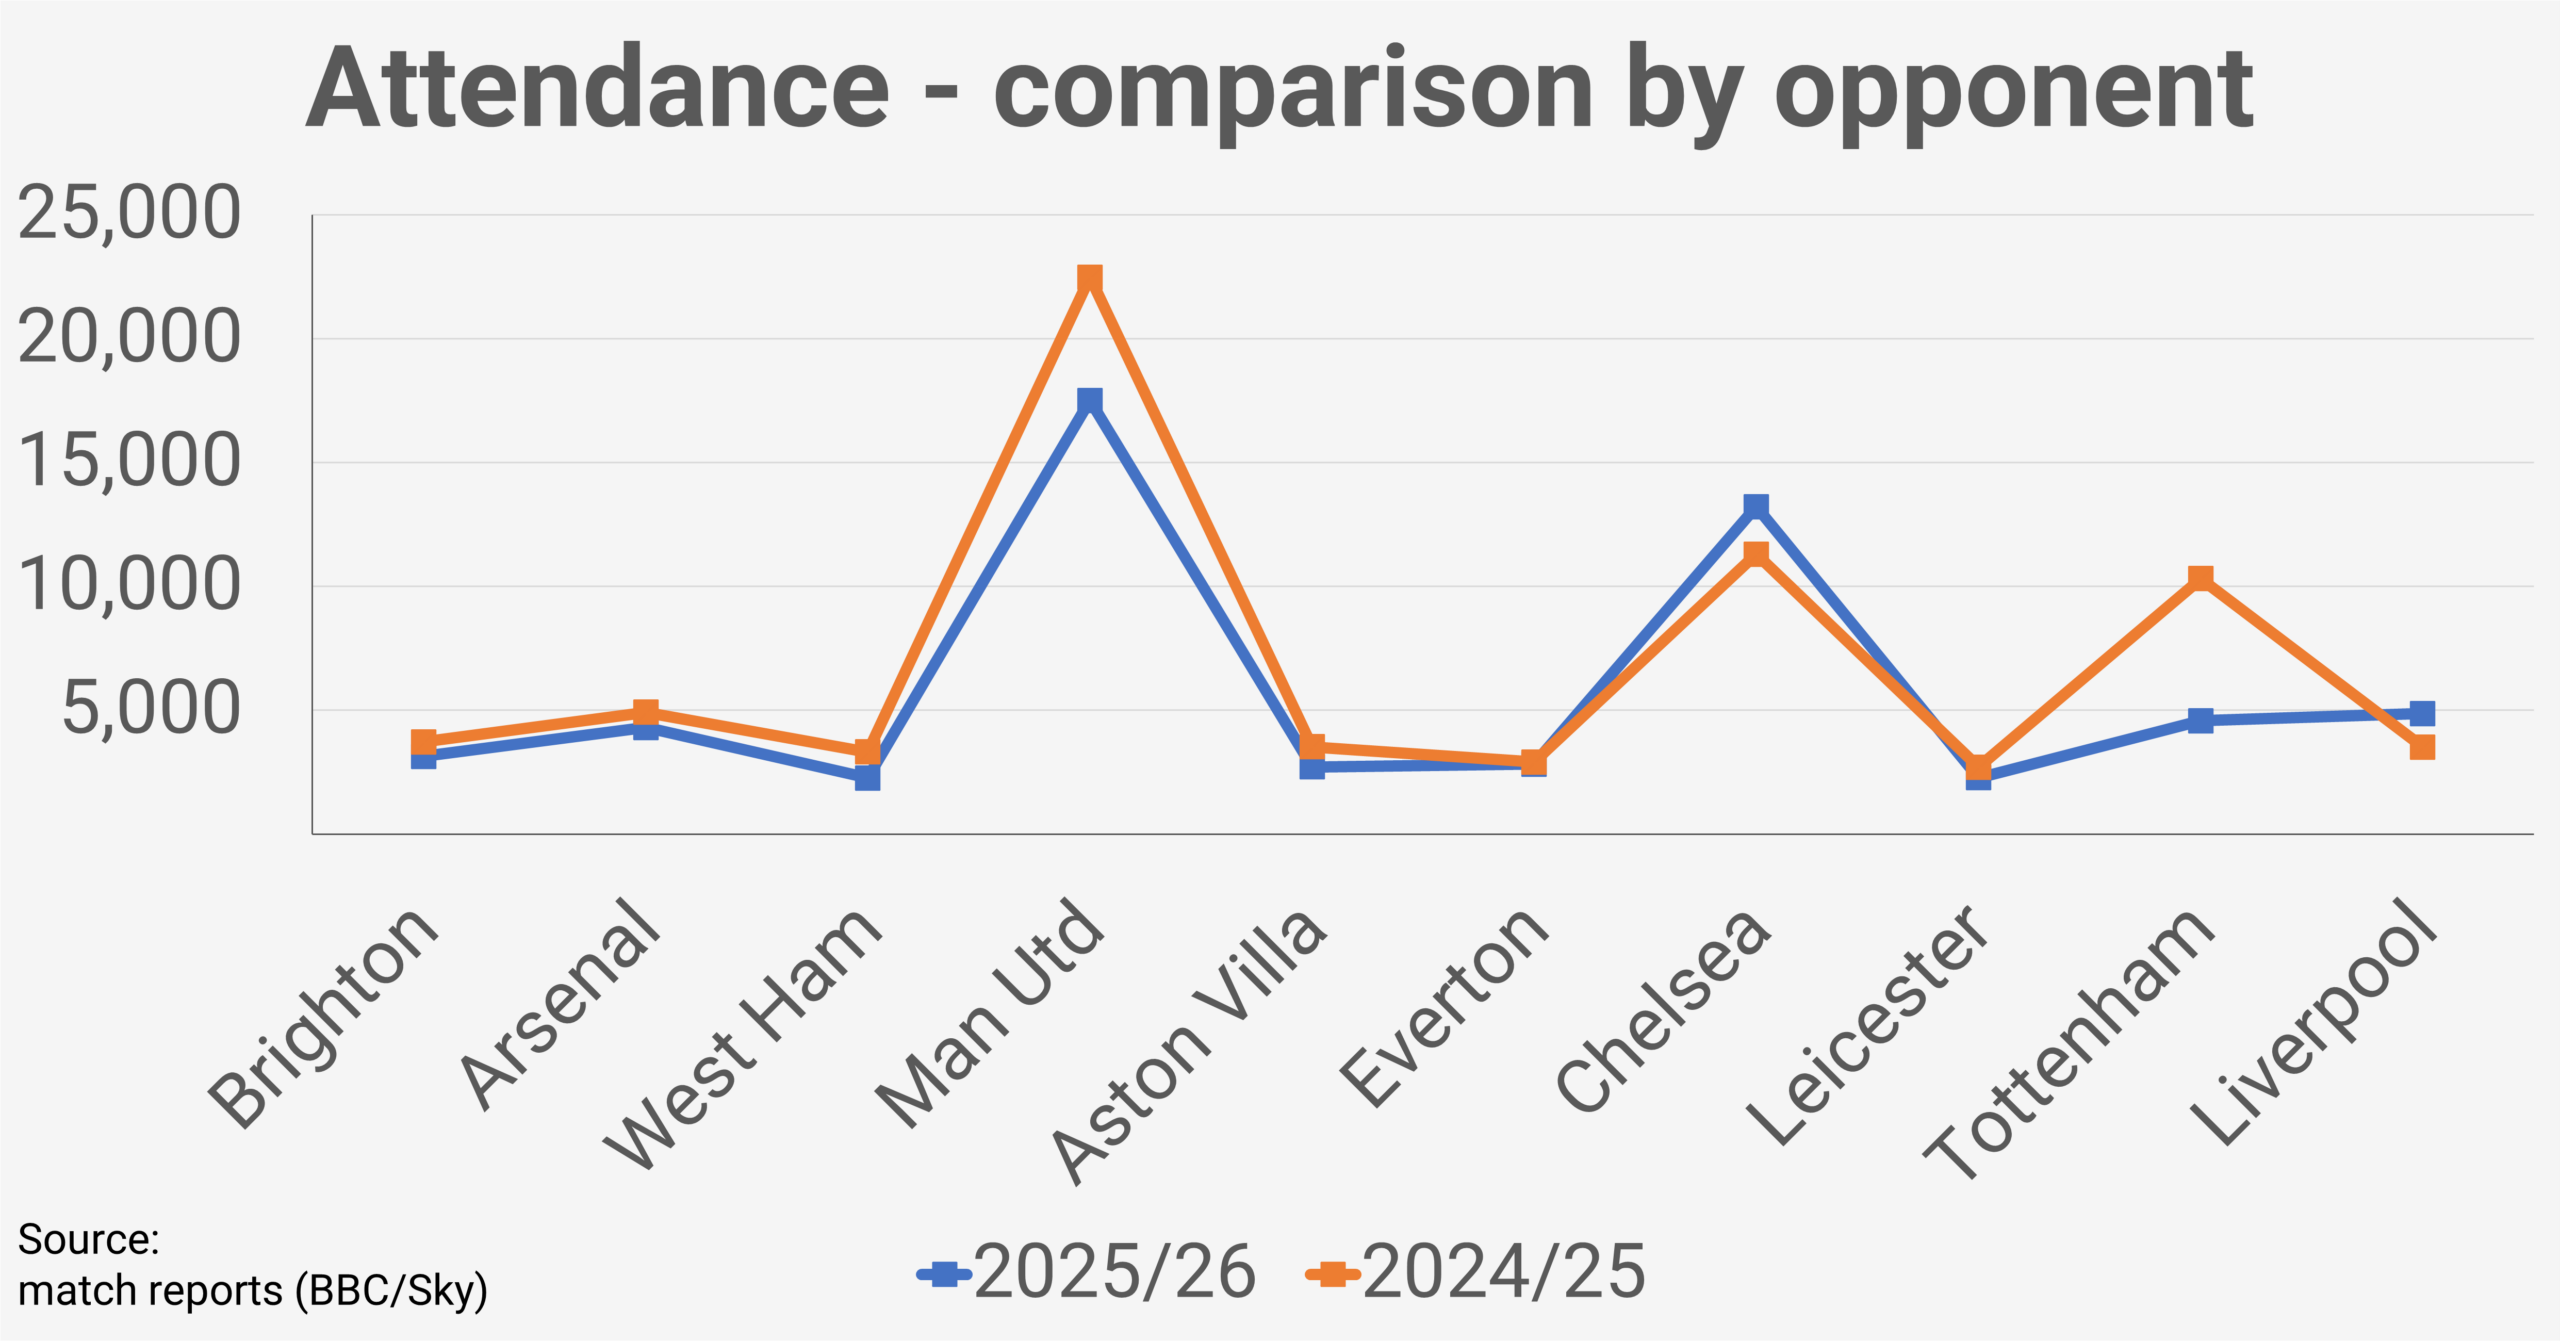
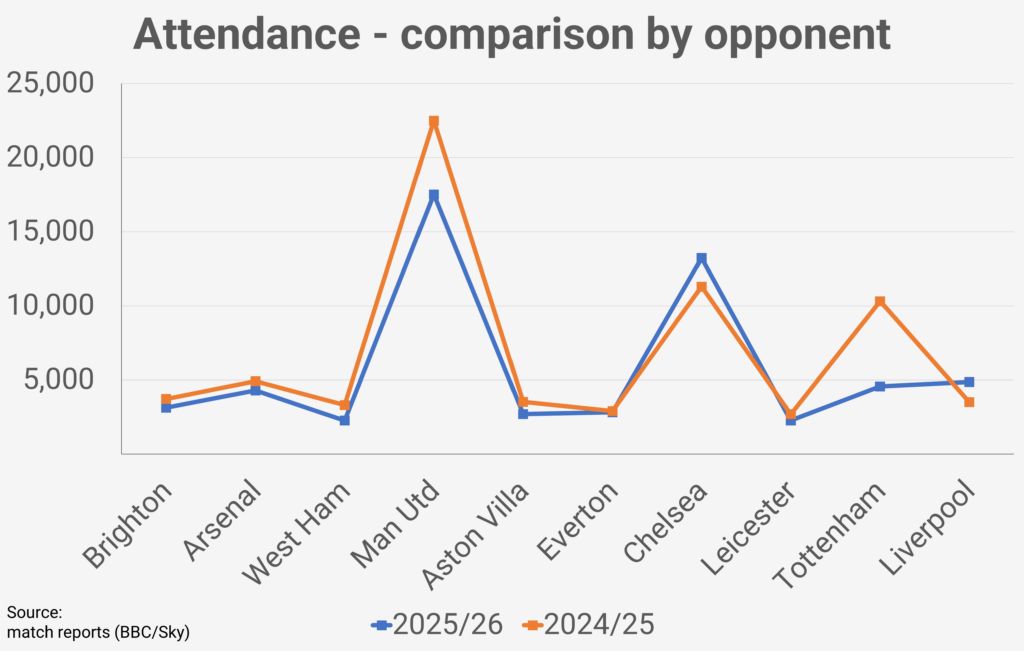
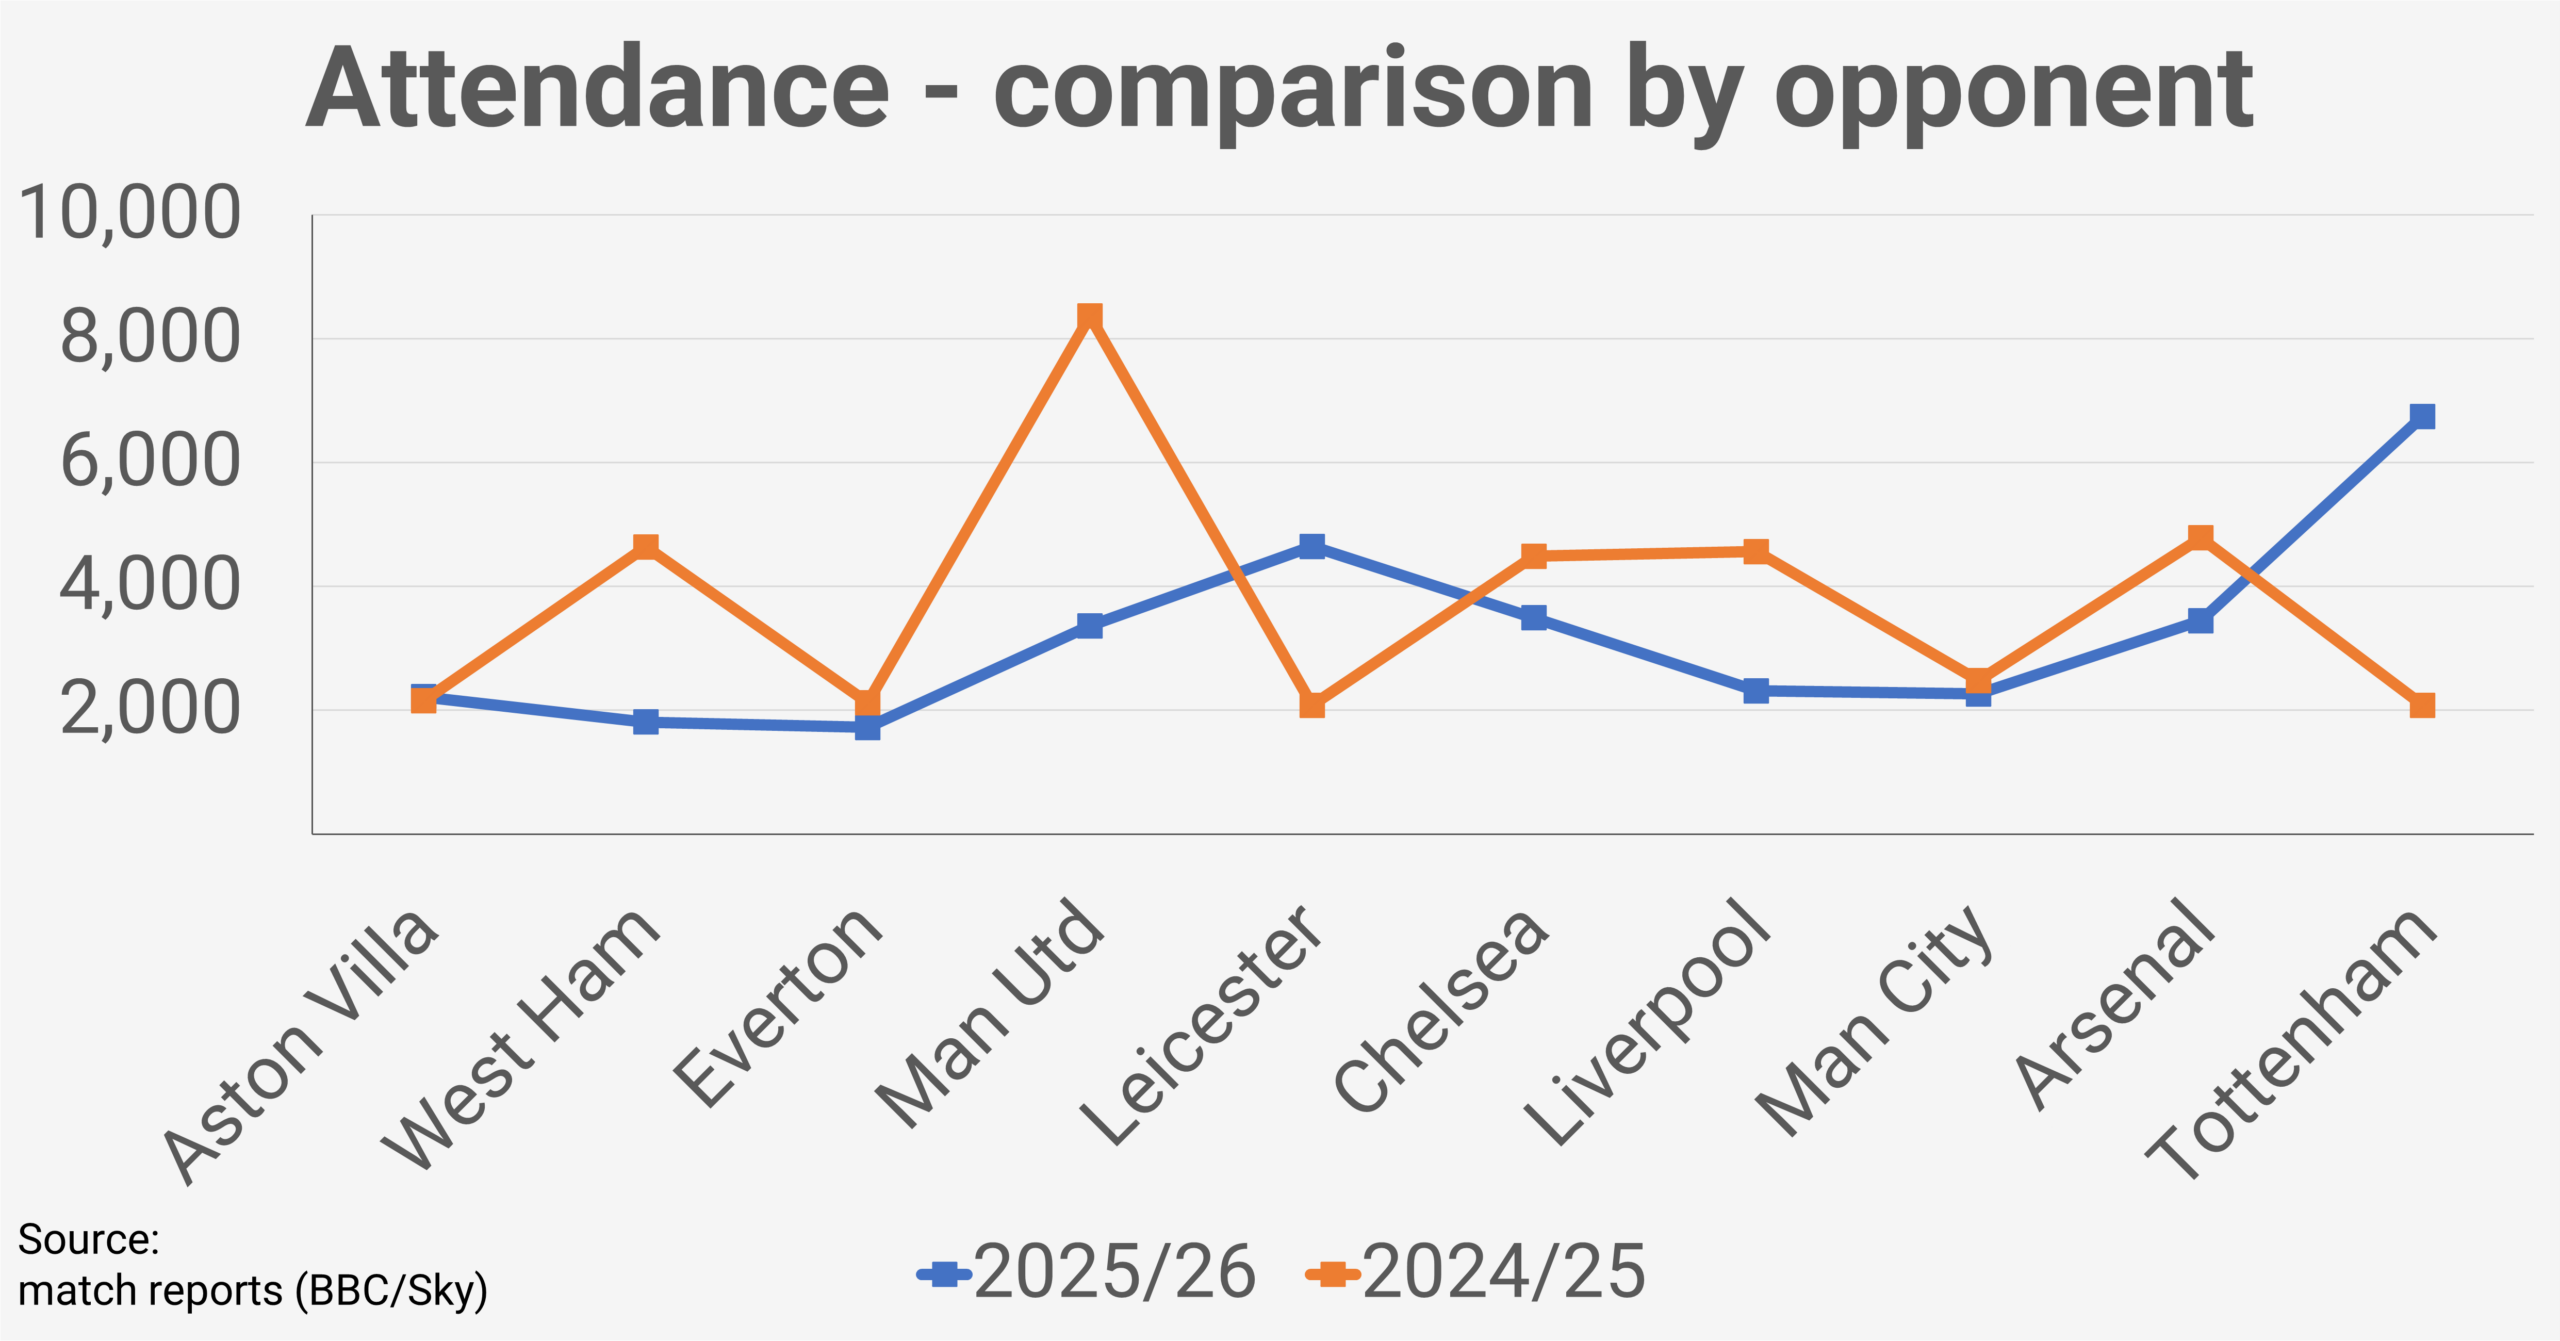
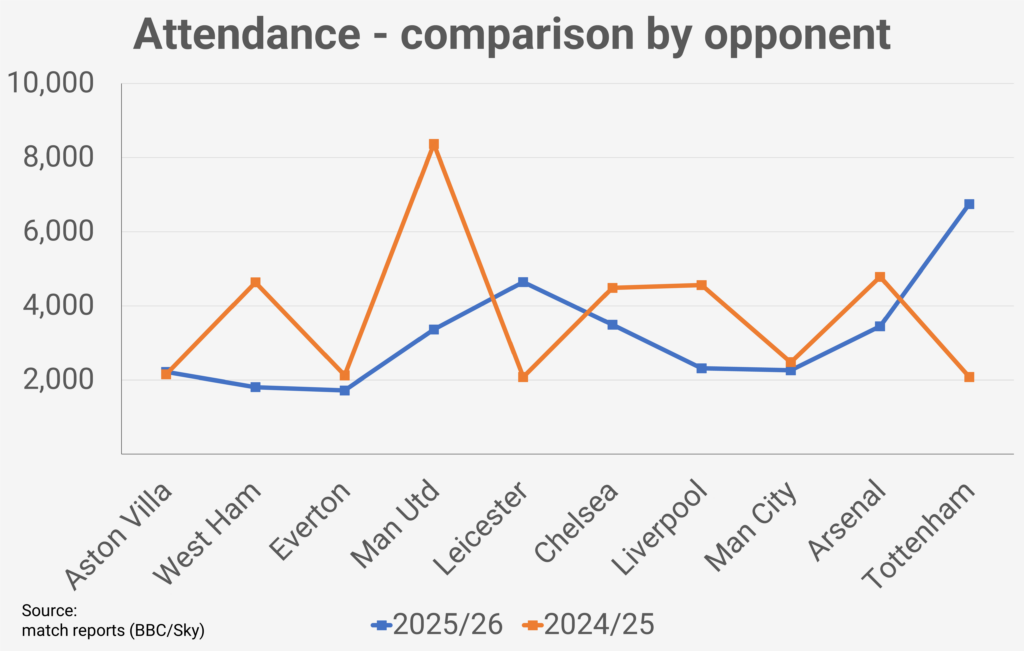
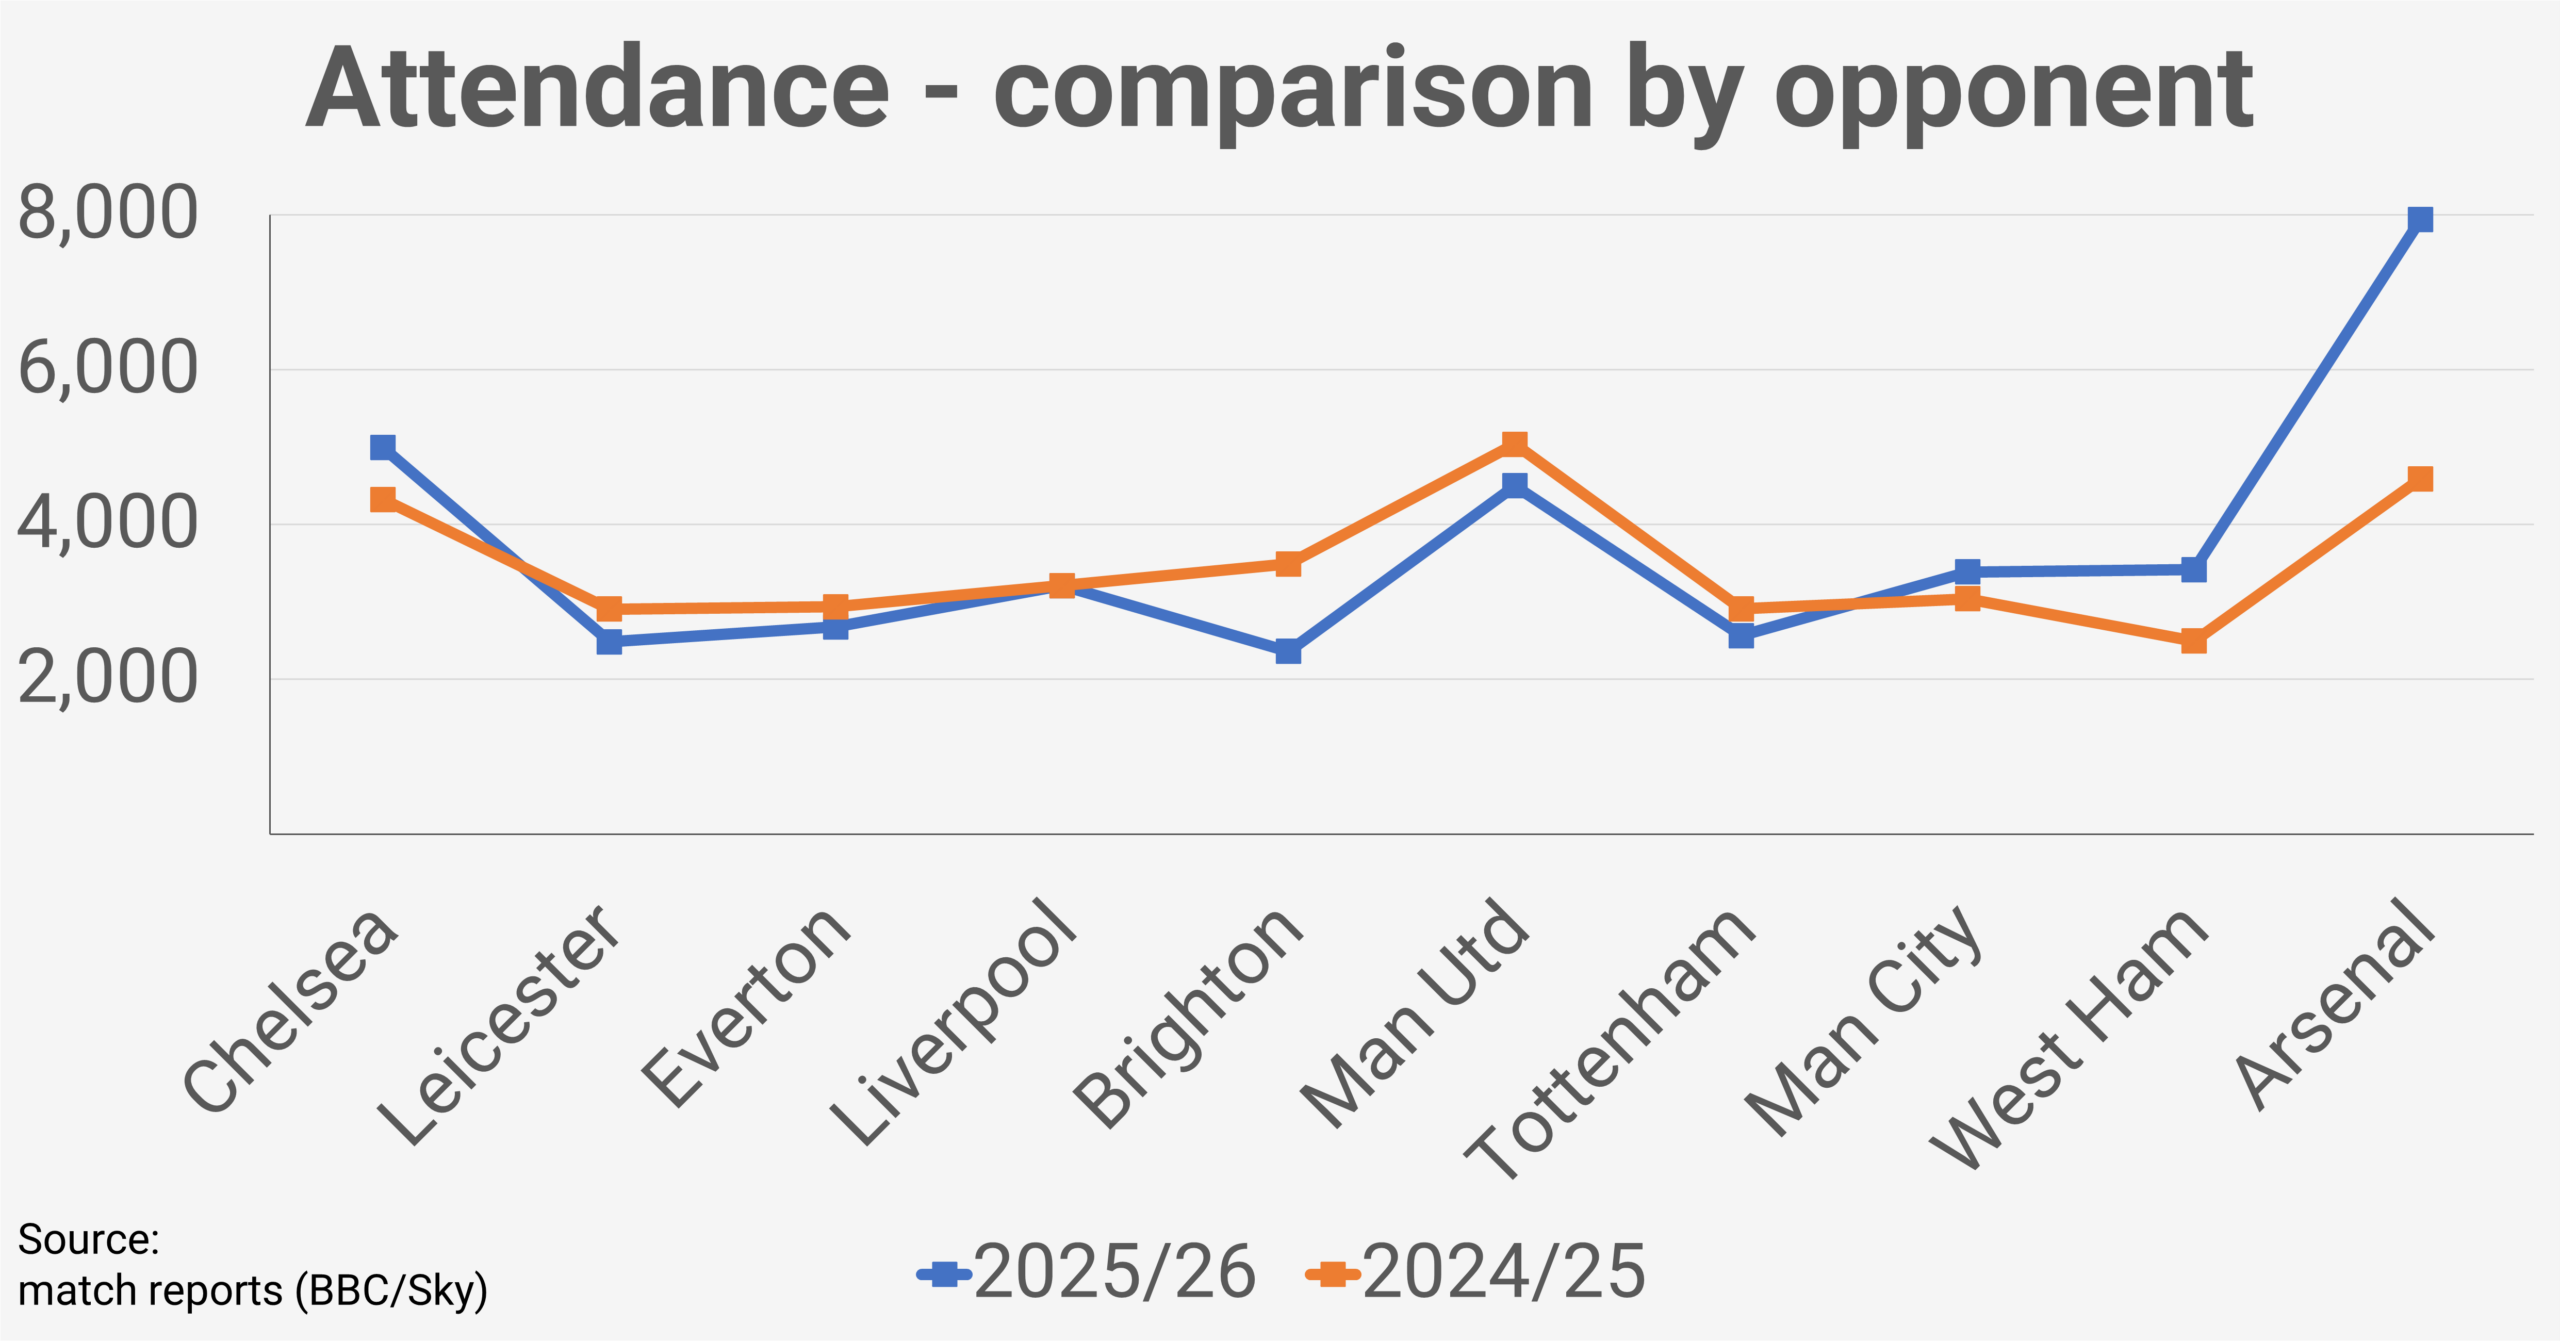
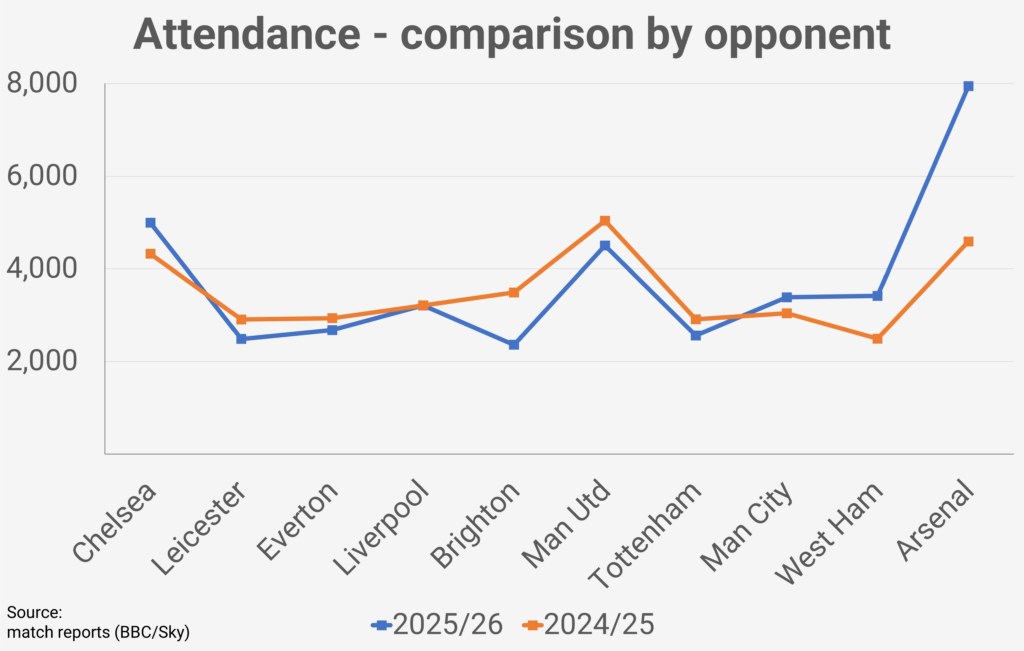
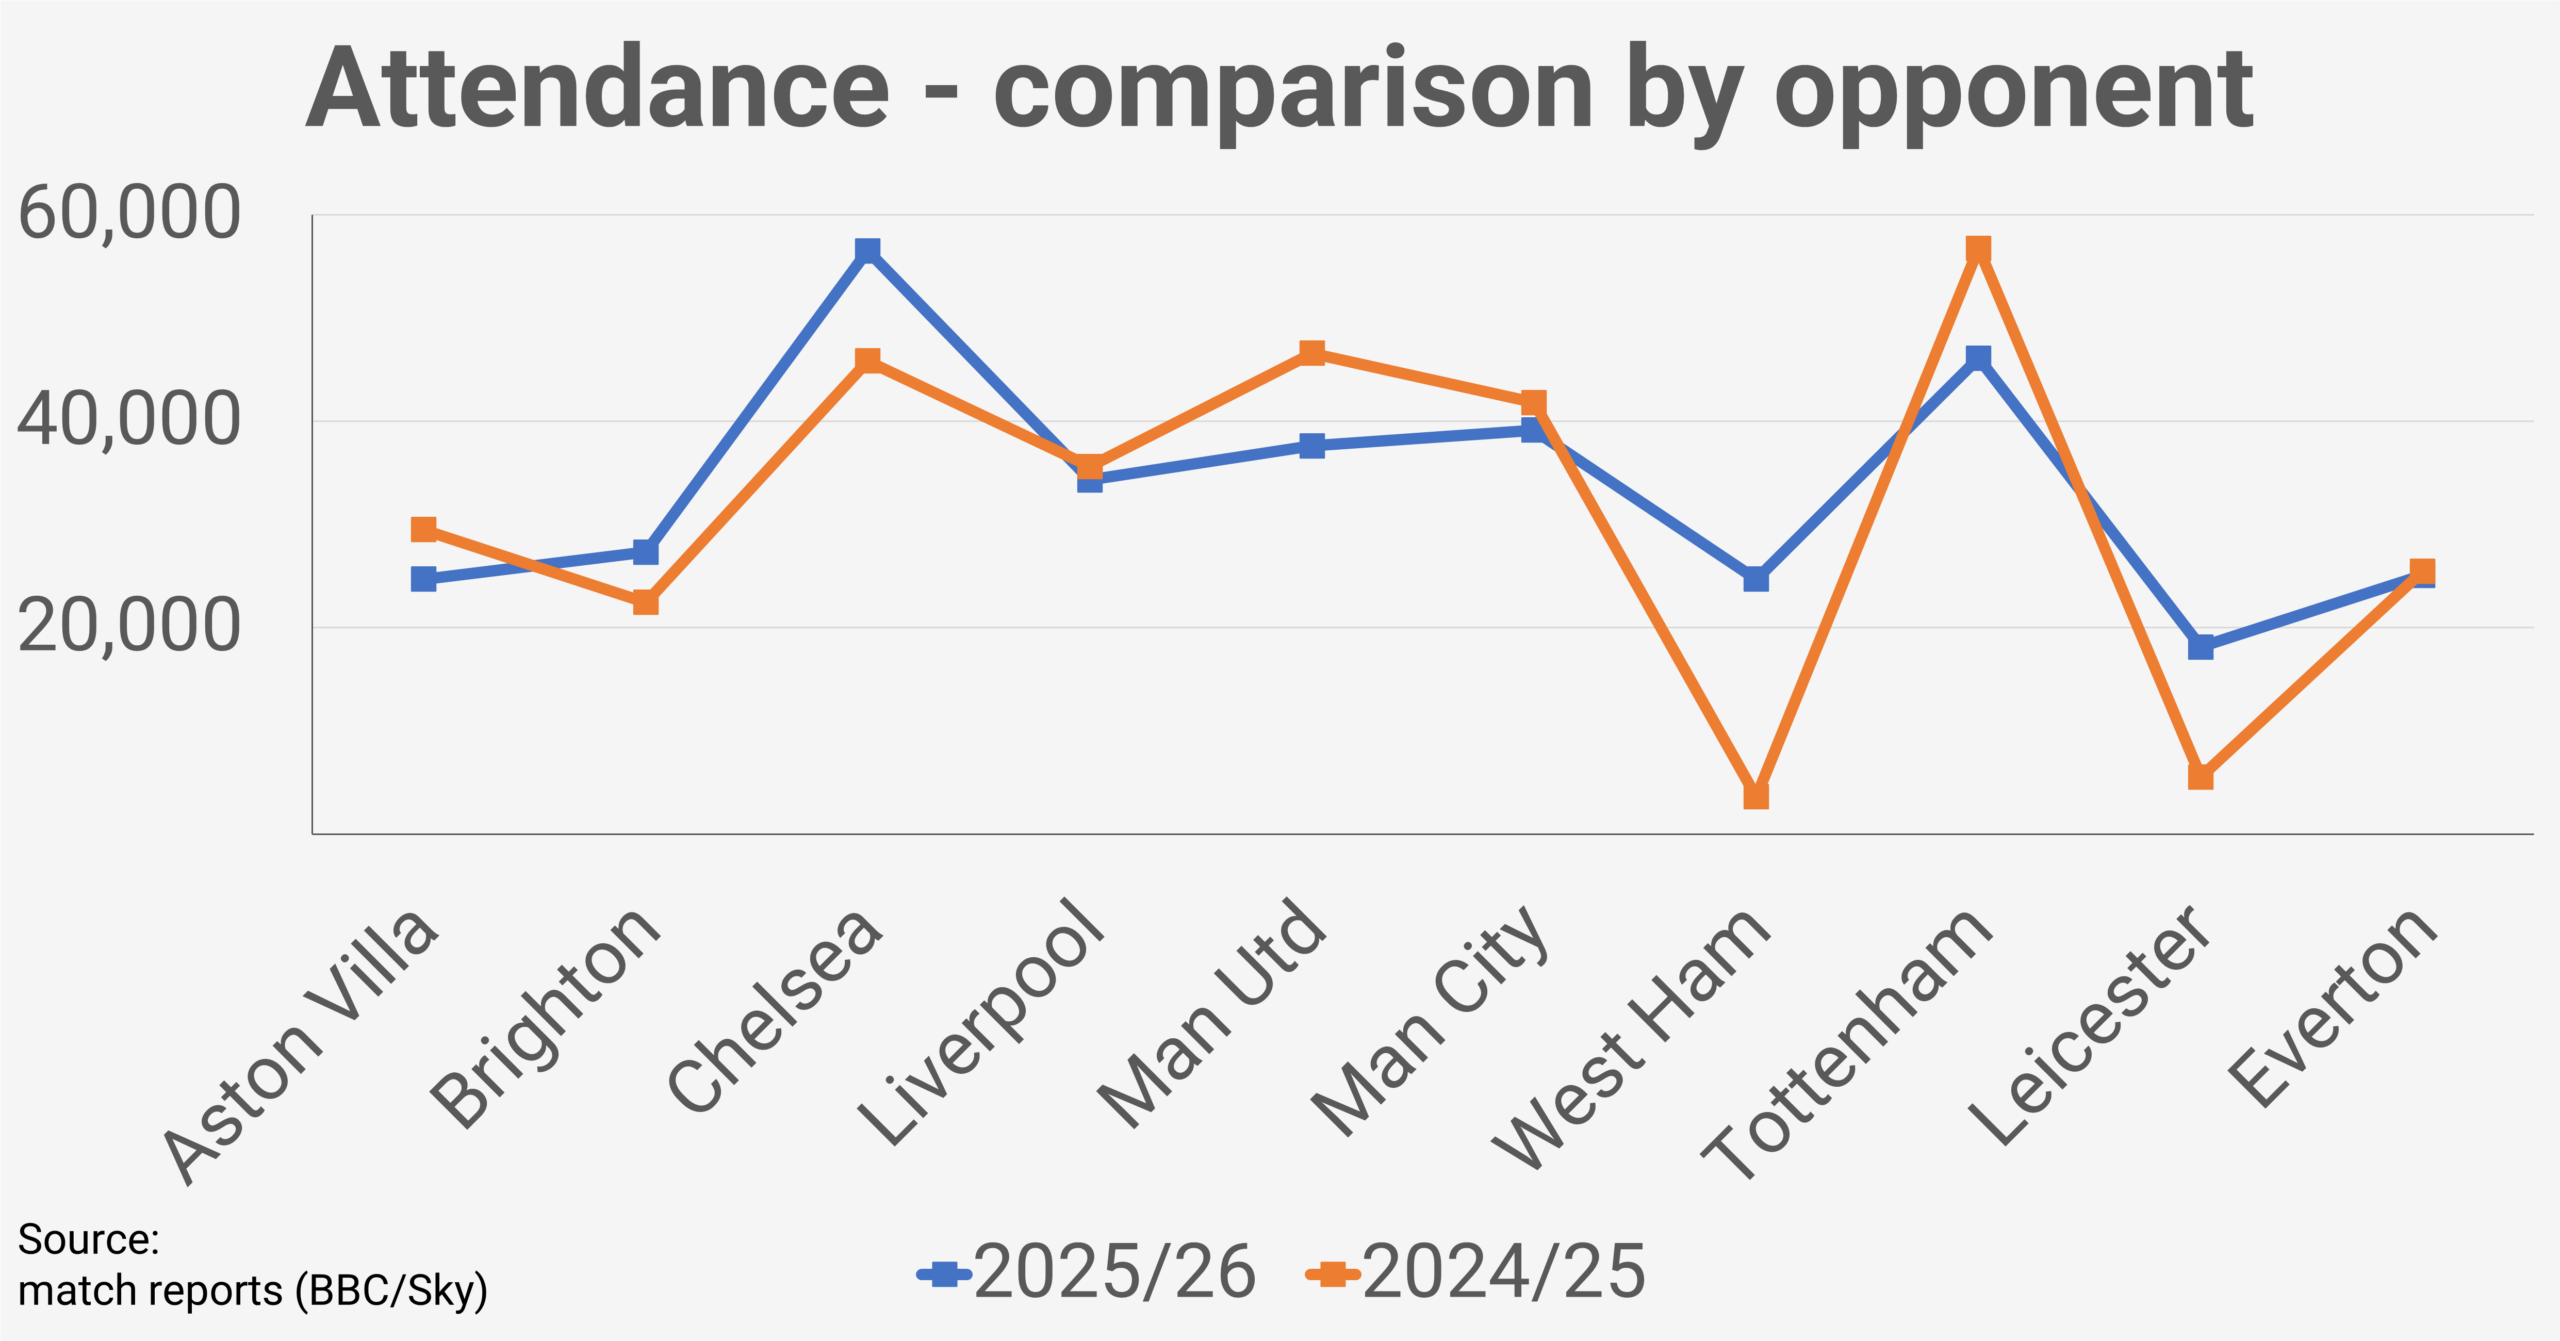
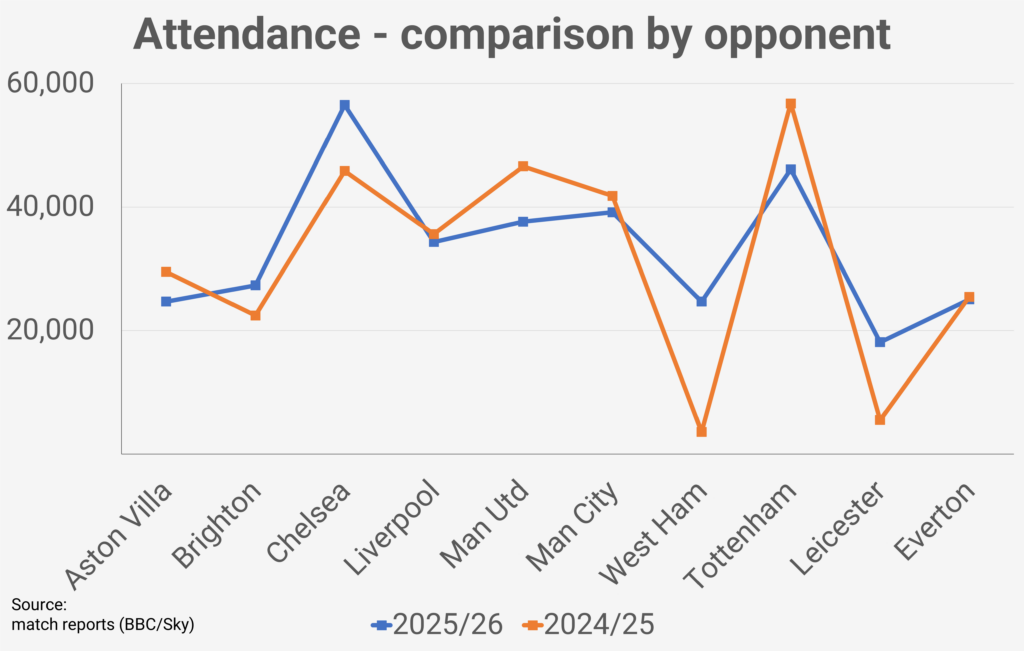
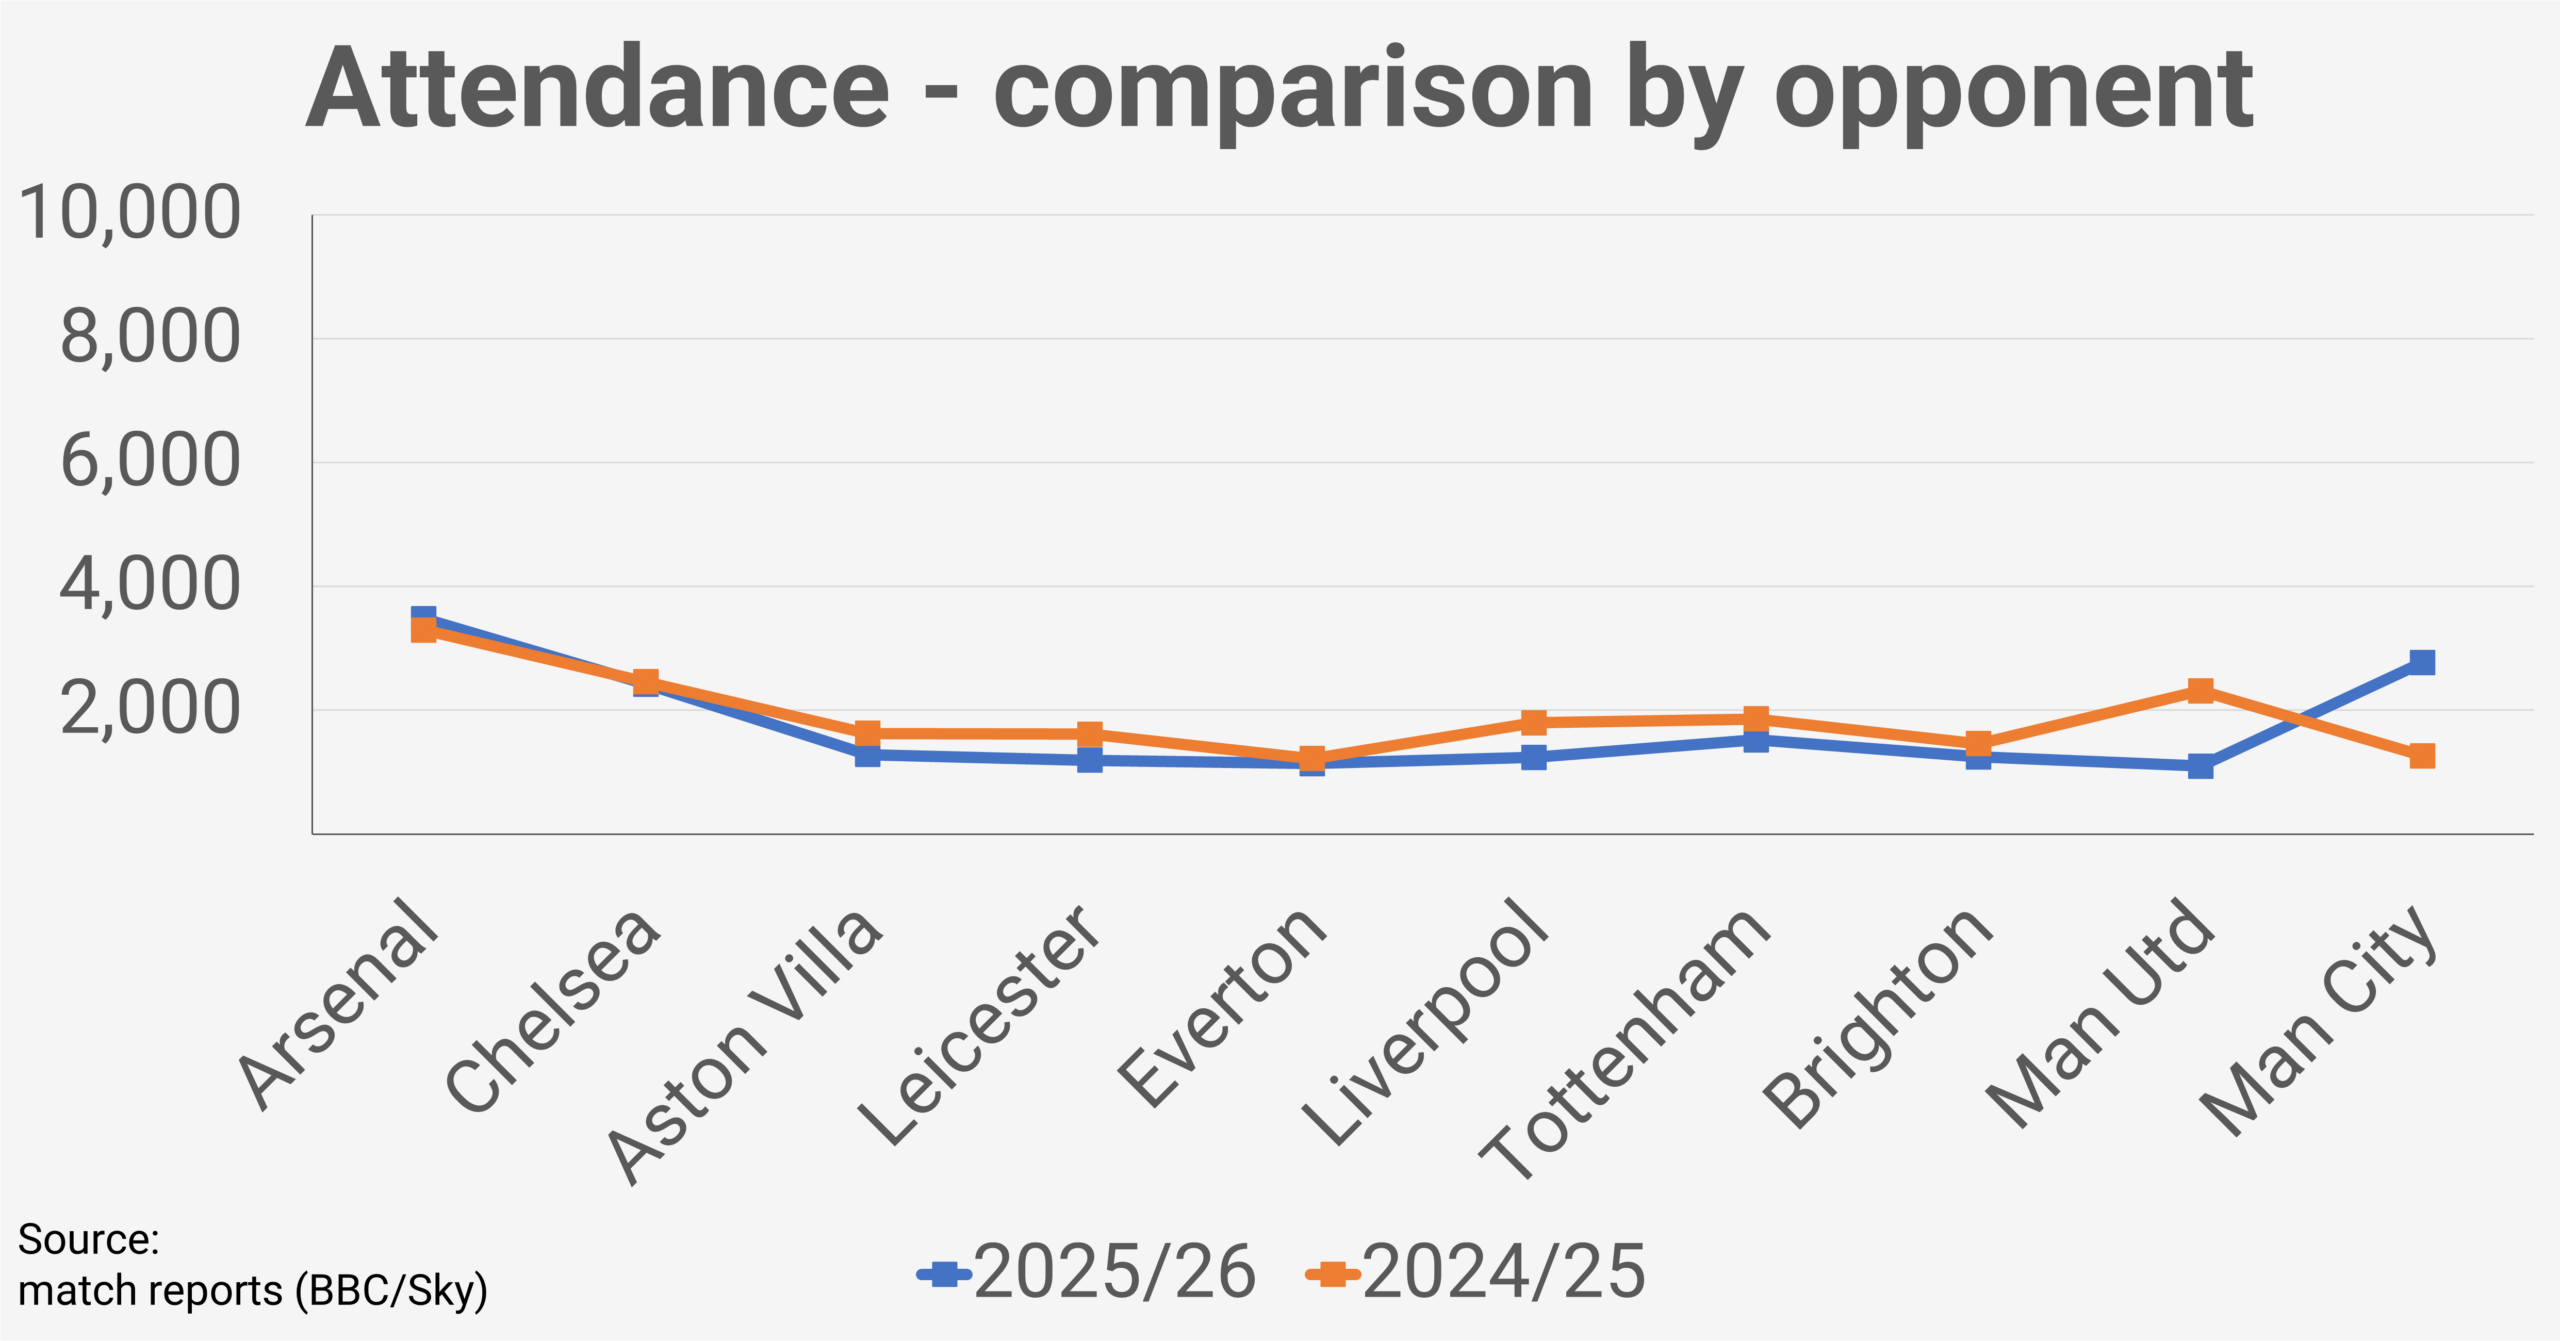
Having last played at the London Stadium in 2019/20, West Ham again staged all their home games at the Chigwell Construction Stadium and finished the season with attendances 7% down on 2024/25.
They opened strongly, recording their third highest ever WSL crowd for the visit of Arsenal (3,483), followed by a Chelsea fixture that dipped just 2% year on year.
The picture changed after two heavy defeat and from that point through to April, attendances fell away, averaging 24% lower than the previous season. The low point came with just 1,097 fans for the visit of Manchester United – a 56% drop on the previous campaign, with a 19:30 Wednesday kick off certainly having an impact.
Even so, West Ham ended on a positive note. Their final home match brought a crowd of 2,774 for Manchester City, their second highest attendance of the season and a much-needed lift to close out the campaign.
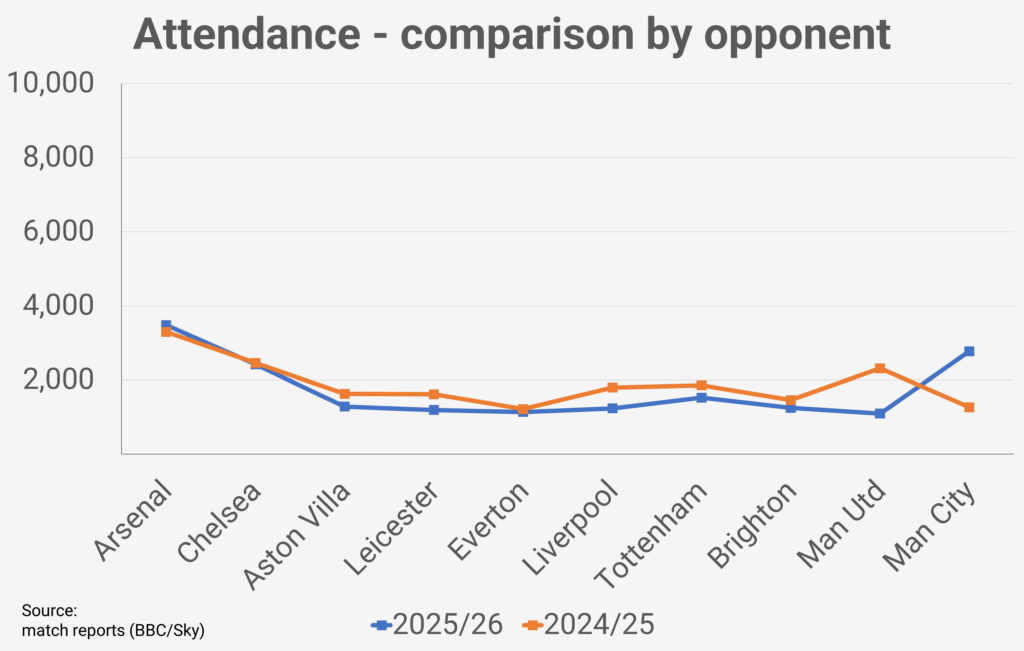
NOTE: The chart above displays attendances for the 2025/26 season in chronological order with comparisons to corresponding games in the 2024/25 season. Newly promoted London City Lionesses and Crystal Palace who were relegated from the WSL at the end of the 2024/25 season are omitted from the chart but are included in the attendance data.